The Case of the Missing Equals Sign #
I was recently investigating suspiciously high CPU usage while typing in documents in Quip’s Mac app. We had recently switched to WKWebView, and this was happening in the “web content” process, suggesting that it was a JavaScript-related problem, or perhaps something related to the CSS/HTML layout computation for documents. Further examination showed that this happened even in small or simple documents, thus likely ruling out layout complexity.
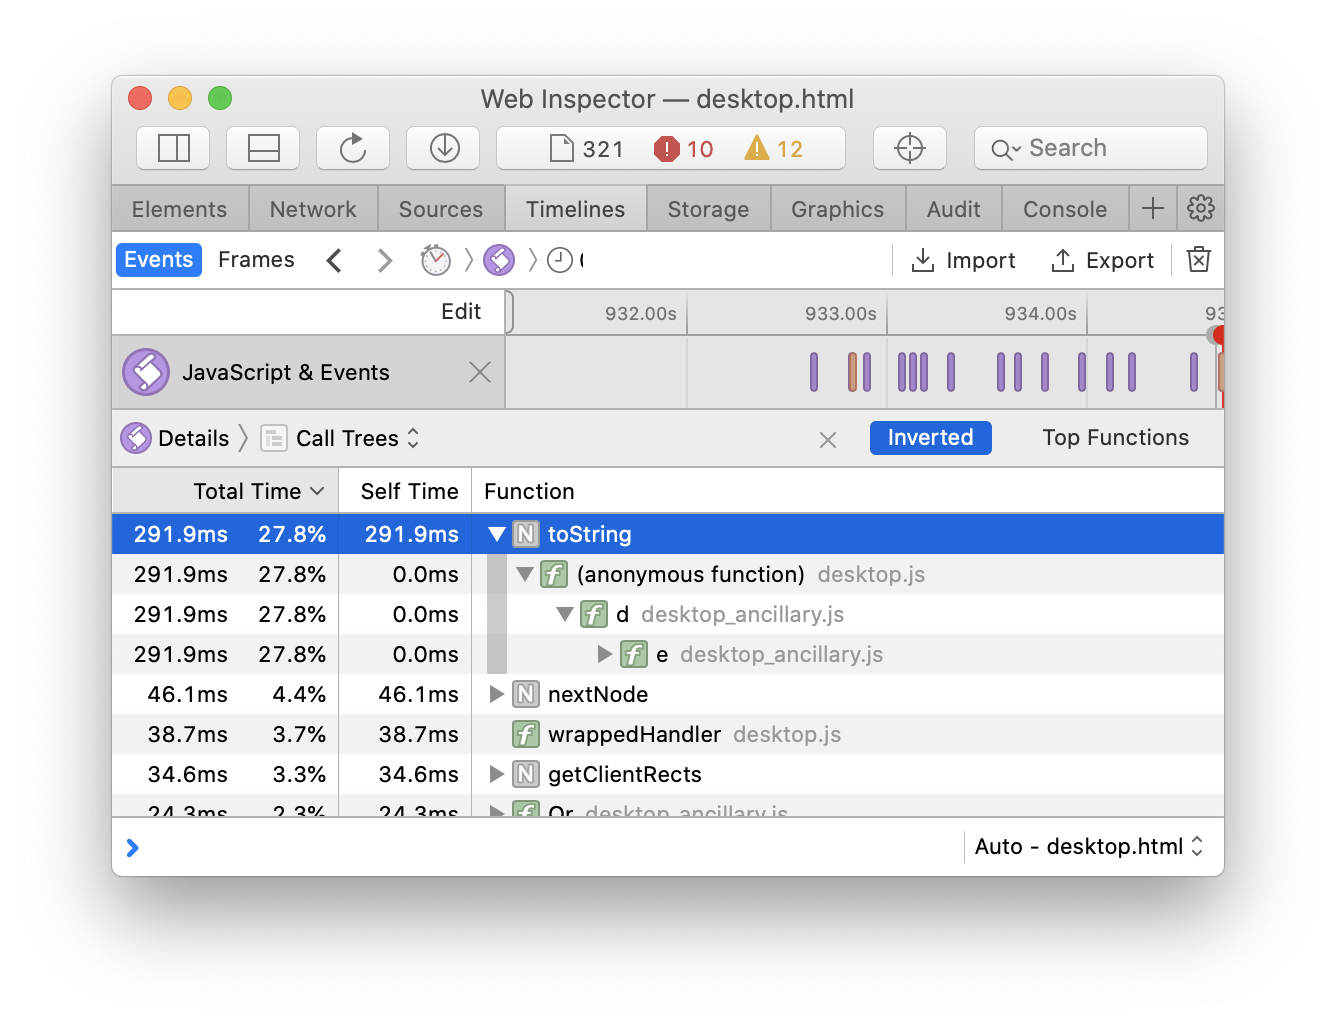
I hooked up the JavaScript profiler in the web inspector’s timeline view (for something so useful, it’s rather buried), and was able to produce this inverted call graph:

What was surprising was that the bulk of the time was spent in the native toString function, as opposed to any code that we had authored. However, it was unclear which toString this was (Number’s, Object’s, Date’s, etc.), or who was calling it — this profile is from the minified JavaScript in our production app, and there’s no easy way to get a full stack trace to apply a source map to. While it is possible to work with the minified code directly, especially in a codebase you’re familiar with, I was hoping to avoid that.
Hoping to get more visibility into the calling code, I switched to running the JavaScript in development mode, where the code is un-minified and served directly as ES6 modules (see our recent blog post for more details). Surprisingly, the behavior went away entirely — toString was nowhere near the top functions. While this was no doubt a clue, it didn’t help with understanding the problem directly.
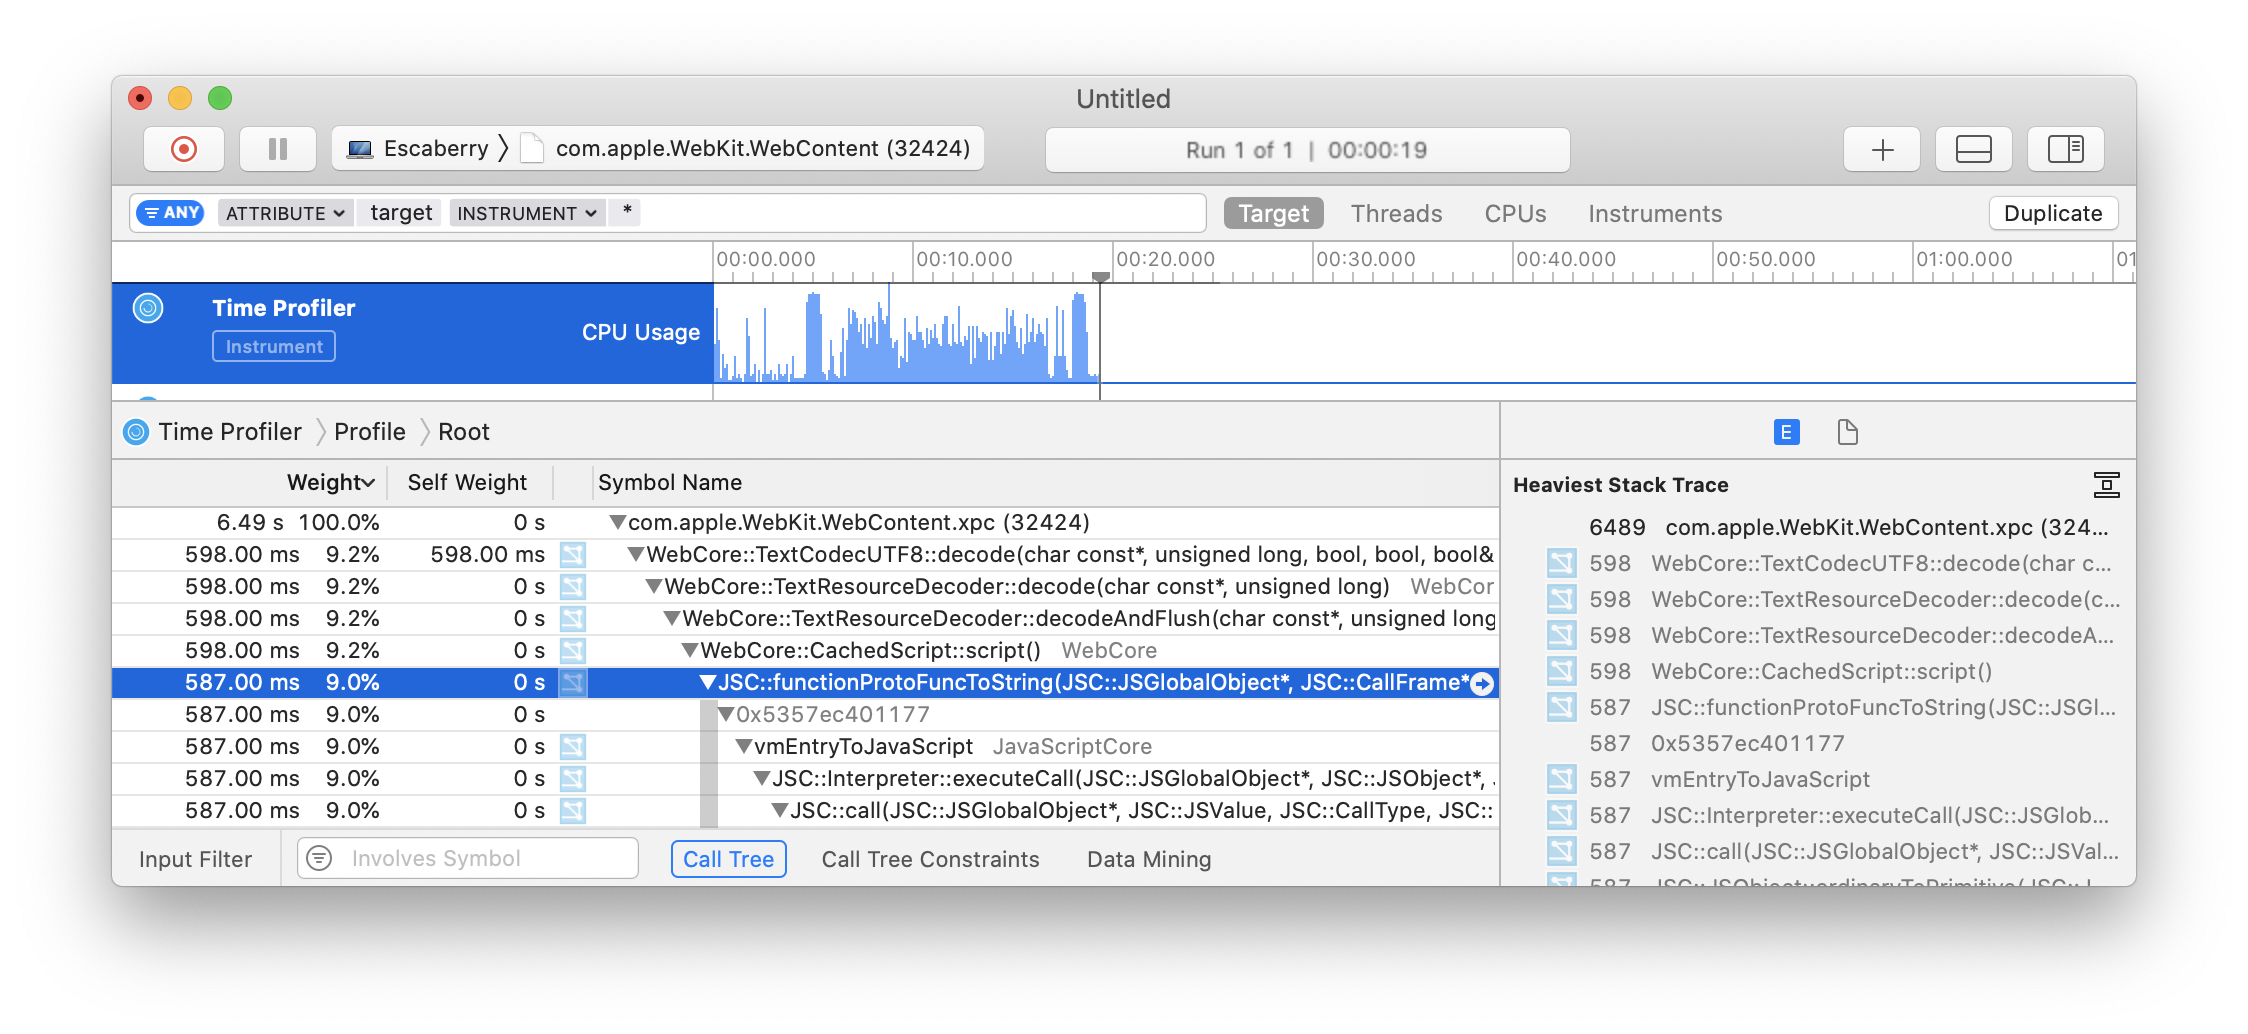
I decided to take a different debugging strategy, and switched to profiling the web content process directly via the Xcode Instruments tool (along the lines of past investigations, it’s possible to determine the PID of the process and attach debugging tools to it).

Happily, the profile lined up with what I saw on the JS side: a lot of time is spent in a toString function. It’s now possible to see which object’s method this is, and surprisingly, it’s Function’s. Or perhaps it should not be surprising: as specified, it’s supposed to return the source code for the function, which may be an expensive operation. In the WebKit/JavaScriptCore implementation, this ends up doing a substring operation on the entire file’s source (and there appears to be no caching). This explains the difference that was observed when looking at prod vs. development mode — in prod mode there’s a single large (multi-megabyte) file, while in development the function happened to live in a smallish (a few kilobytes) file.
Now that I knew where the problem was, I added a small monkey-patch to see where the stringification was happening:
const originalToString = Function.prototype.toString;
Function.prototype.toString = function () {
    const startTime = performance.now();
    const rv = originalToString.call(this);
    const runTime = performance.now() - startTime;
    console.groupCollapsed(
        `Function.prototype.toString call: ${runTime.toFixed(3)}ms`);
    console.trace();
    console.groupEnd();
    return rv;
};
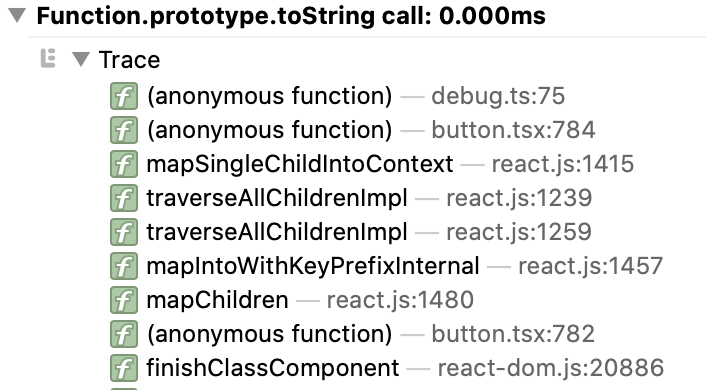
This yielded the following trace:

Following through on the button.tsx stack frame pointed to a line with an if (button.type != Button) {...} expression. At first glance it does not appear to be doing any string conversions, but that is what the != operator ends up doing. This is because button is a React element, and the type property is either a string (if it’s a built-in DOM element like div or span) or a class/function (if it’s a custom element). Originally, all elements on this code path (which is invoked whenever the user types) were custom elements, thus the != was comparing one function to another. This is fast since it uses reference equality. However, at some point some DOM children were introduced, and we were comparing a string and a function. Since we’re using !=, this is a loose equality comparison, and we end up stringifying the function operand to make it comparable to the string one.
The fix turned out to be trivial: change the comparison to use !== so that strict equality is used. We’ve been preferring strict equality for most new code, but had not enabled the linting rule to enforce it because it’s a slog to work through all of the legacy violations. This experience shows that it’s not just a matter of preferring strict equality to avoid WAT moments, but that there are performance benefits as well.
Update on July 20, 2021: I recently noticed that WebKit has now added a caching performance optimization for Function.prototype.toString, most likely removing this pitfall.
2 Comments
Post a Comment