Showing posts with label Quip. Show all posts

Slack Canvas In The Streets, Quip In The Sheets #

I finally got access to the recently-launched Slack canvas feature. This project was the last thing I worked on before I left Quip/Slack/Salesforce in April of 2022, and I was curious how it had evolved since then.

Canvas started as a prototype in mid-2021 to reuse Quip technology to power a collaborative editing surface inside of Slack. The initial phase involved Michael Hahn and I doing unspeakable things with iframes1 to get the two large codebases to work togetherwith minimal changes. This allowed a relatively rich feature set to be explored quickly, but it was not something that was designed to be generally available. At the time of my departure the work on productionizing (the second 90% of the project) had just begun.

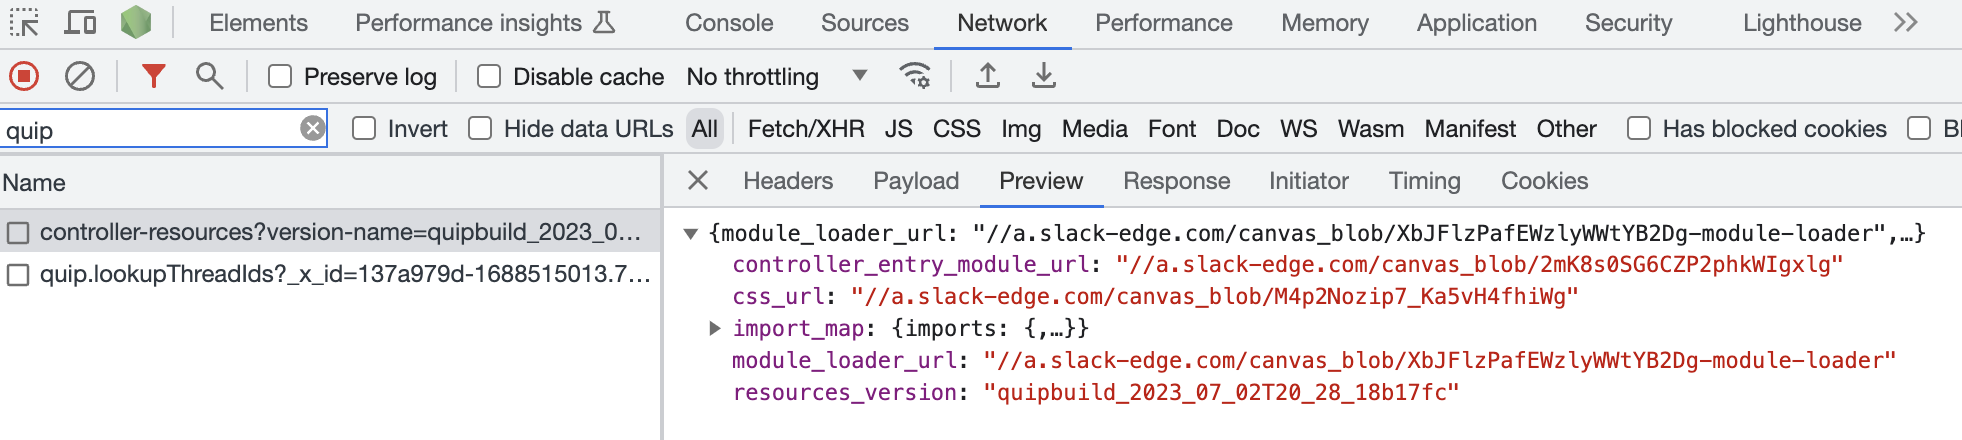
The first thing that becomes apparent is that the roots of canvas in Quip are entirely hidden from the user — no Quip references in the announcement or anywhere in the UI. This makes sense from a “don’t ship your org chart” perspective — no user should care how a feature is implemented. However, if you peek under the hood, you can start to see the some Quip tidbits. The most obvious place to start is to look for network requests with quip in them — a couple of which happen when loading a Slack canvas:

Slack canvas network requests

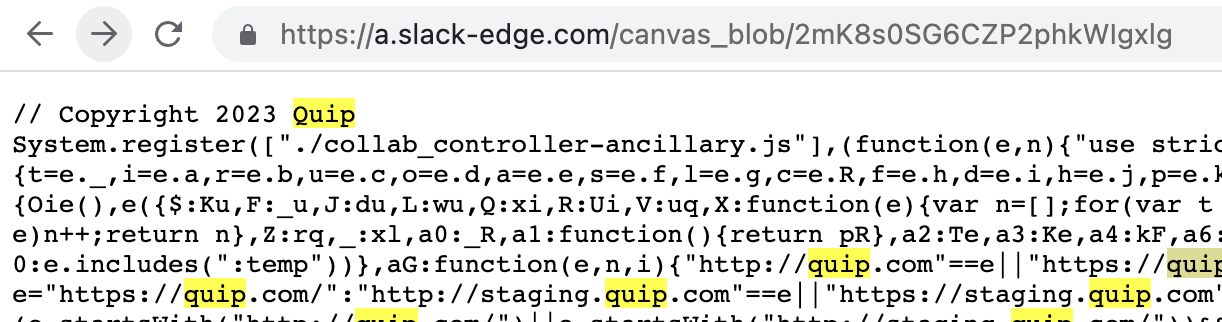
The “controller” is the core logic of Slack canvas editor, and we if load one of those URLs, we see even more Quip references:

Slack canvas Quip minified JavaScript

The DOM also resembles Quip’s, down to the same CSS class names being used. The need to scope/namespace them to avoid colliding with Slack’s was one of the open questions when I left, but I guess Slack has a BEM-like structure which ensures that Quip’s simpler class names don’t collide (as long as they don’t integrate another similar un-prefixed codebase). There are also no iframes in sight, which is great.

Slack canvas DOM structure

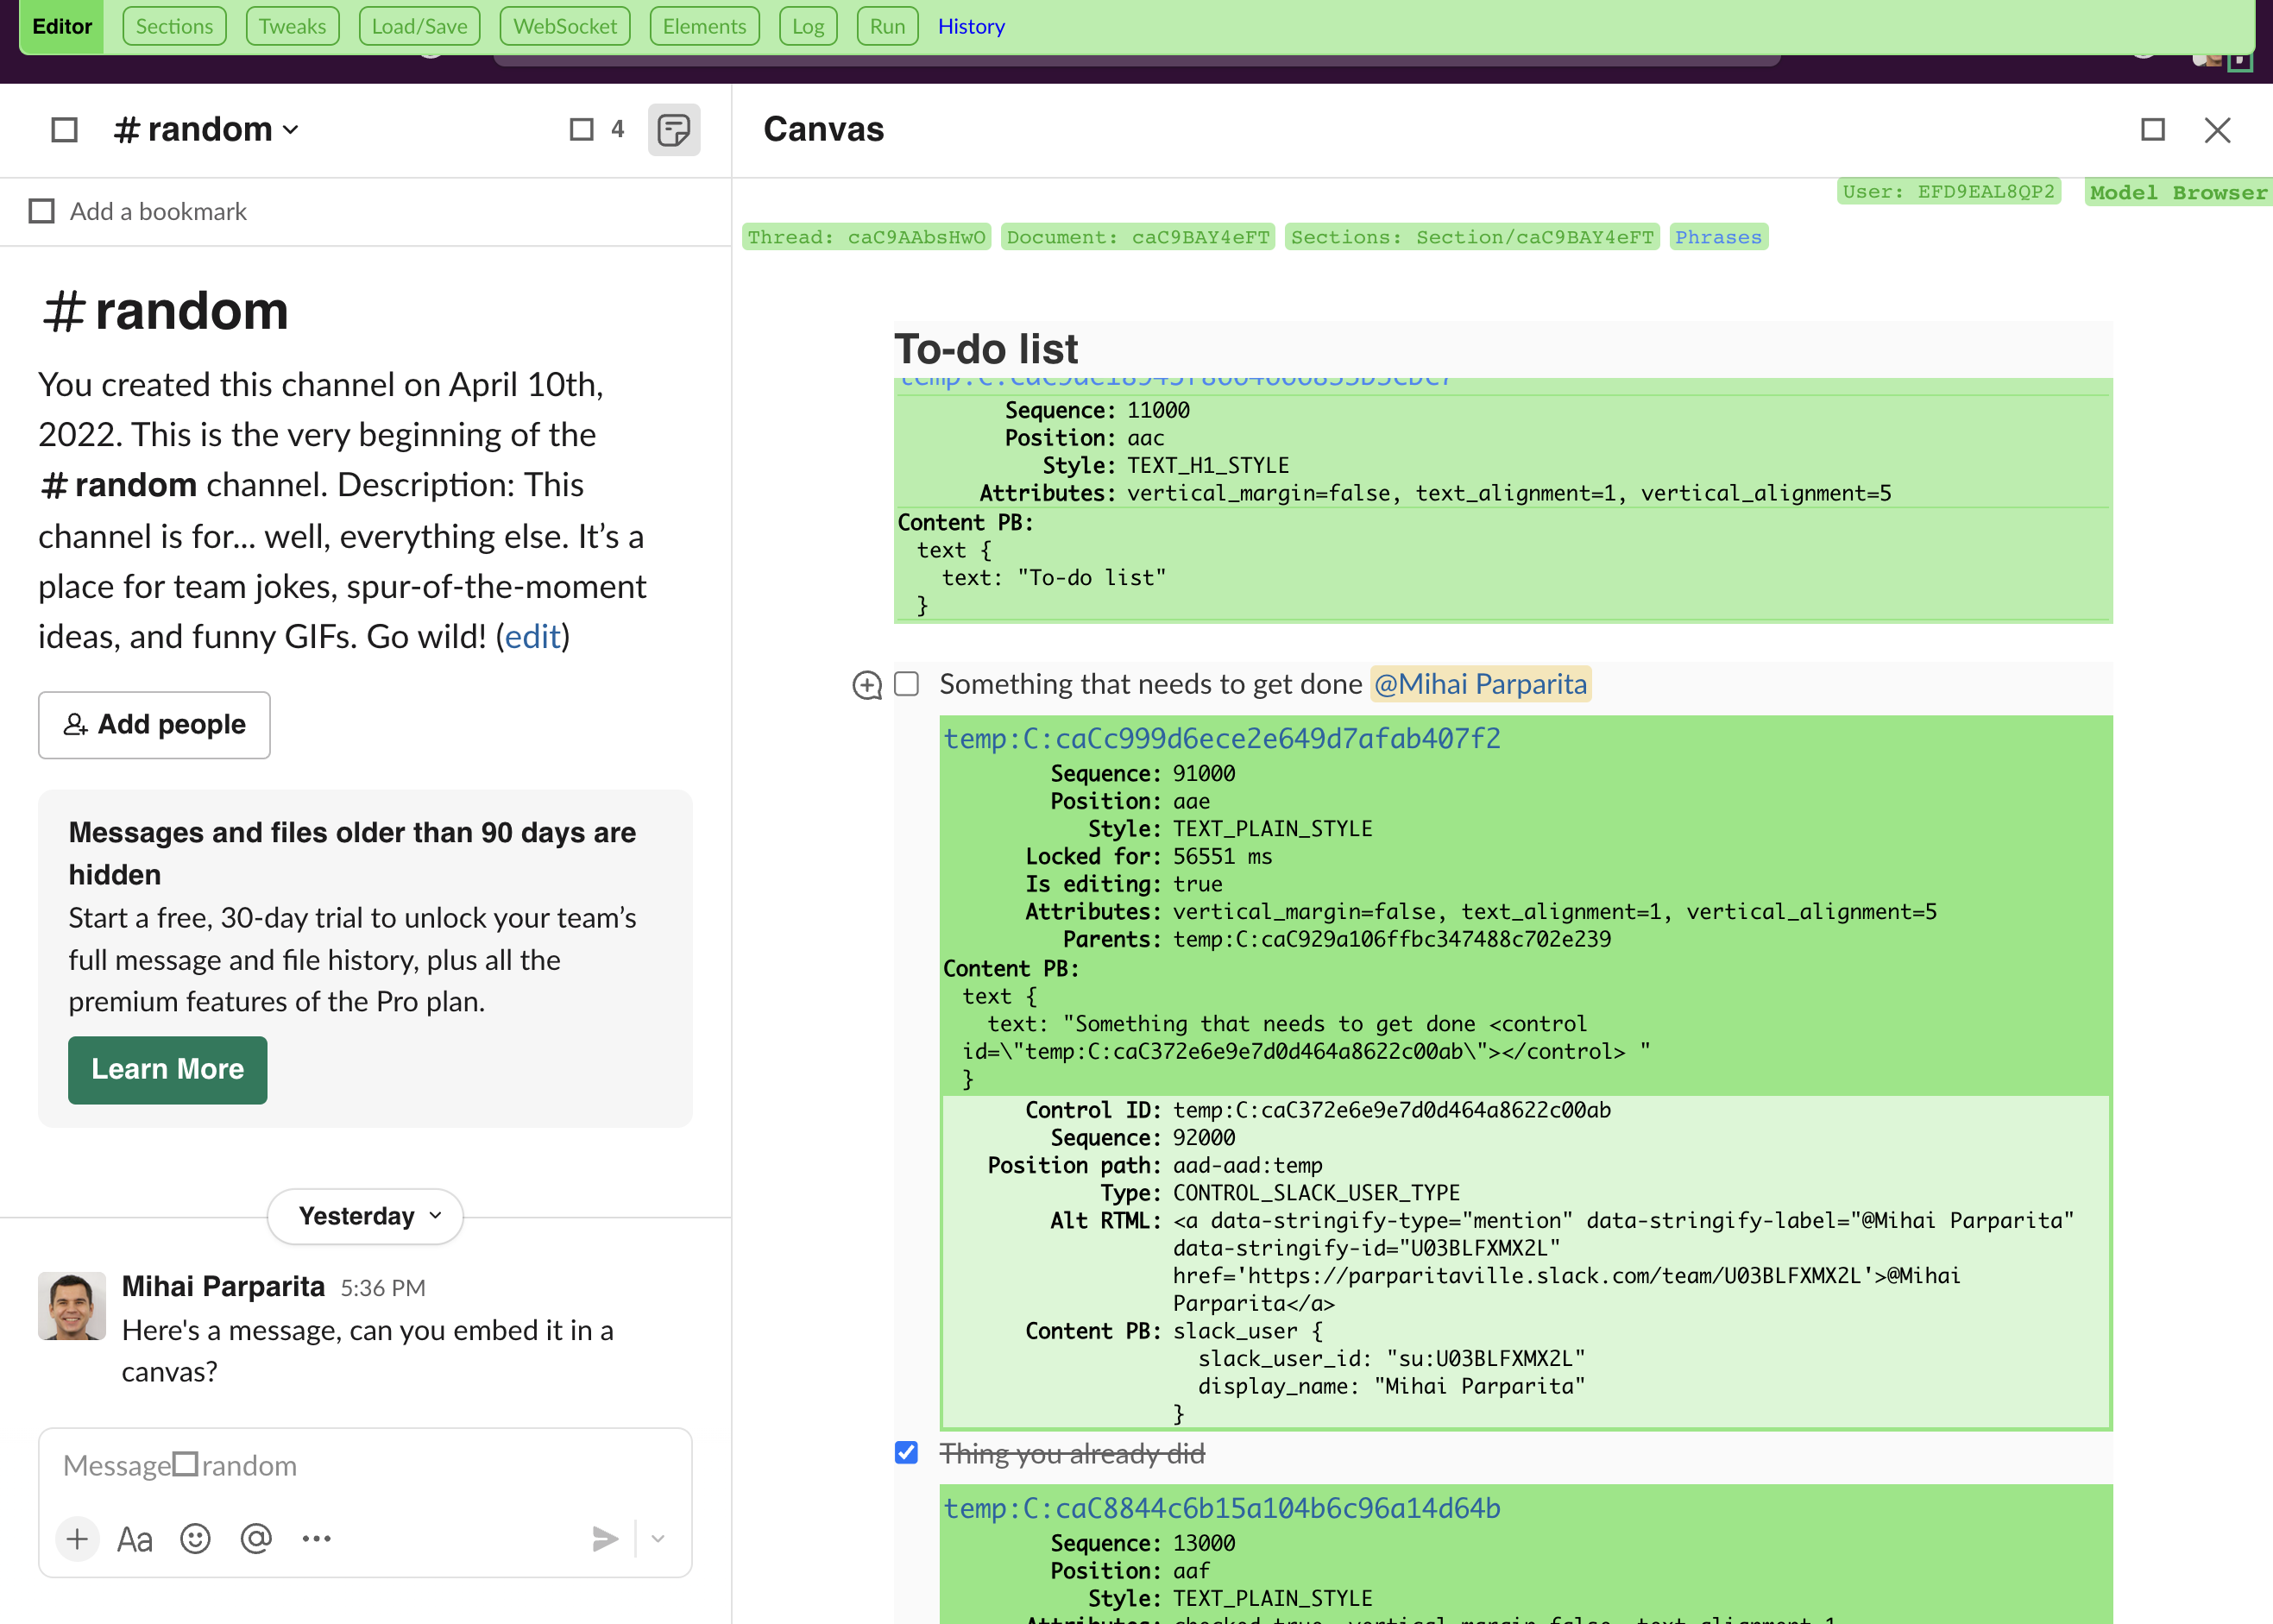
Quip also had extensive in-product debugging tools, and I was curious if they also made the transition to Slack canvas. They’re normally only enabled for employee accounts, but as hinted there is a way to enable them as a “civilian” user too. A couple of commands in the dev tools, and I was greeted by the green UI that I had spent so many years in:

Slack canvas showing Quip's debug tools

I was also hoping that copying/pasting content from Quip into Slack canvas was a backdoor way to get some of features that have not (yet?) made the transition (spreadsheets, date mentions, etc.), but it does not appear to work.

On the mobile side, I had explored reusing Quip’s hybrid editing approach in the Slack iOS app, including the core Syncer library. Hooking up Console.app to an iOS device shows that the Syncer (and thus Quip) are still involved whenever a canvas is loaded.

Slack canvas iOS logging showing Quip references

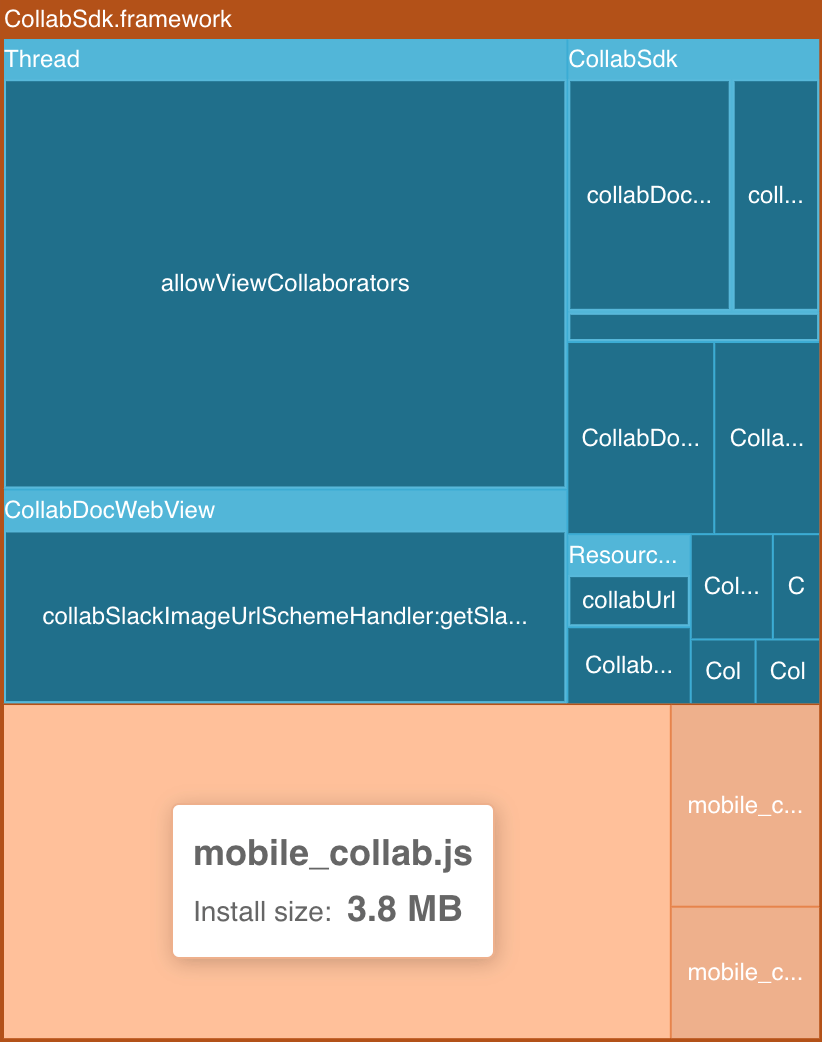
One of the open questions on mobile at the time of my departure was how to render Slack content that’s embedded in a document. Quip’s mobile editor is a (heavily customized) web view, so that we can reuse the same rendering logic on all platforms. It's possible to see that the canvas rendering is still web-based by inspecting the Slack app bundle (Emerge Tools provides a nice online tree view) – there is a mobile_collab.js file which implements document rendering:

CollabSdk.framework embedded in the Slack iOS app (as of June 2022)

Slack on the other hand is an entirely native app. Porting Quip’s editor to native components didn’t seem feasible on any sort of reasonable timeframe. It was also not appealing to reuse Slack’s web components on mobile, since they weren’t designed for that (either from a UI or data loading perspective). I had speculated that we could leave a “placeholder” element in the web view for Slack-provided UI (like a message card), and then overlay the native component on top of it. But I wasn’t sure if it would be feasible, especially when the document is scrolled (and the native view overlay would have to be repositioned continuously).

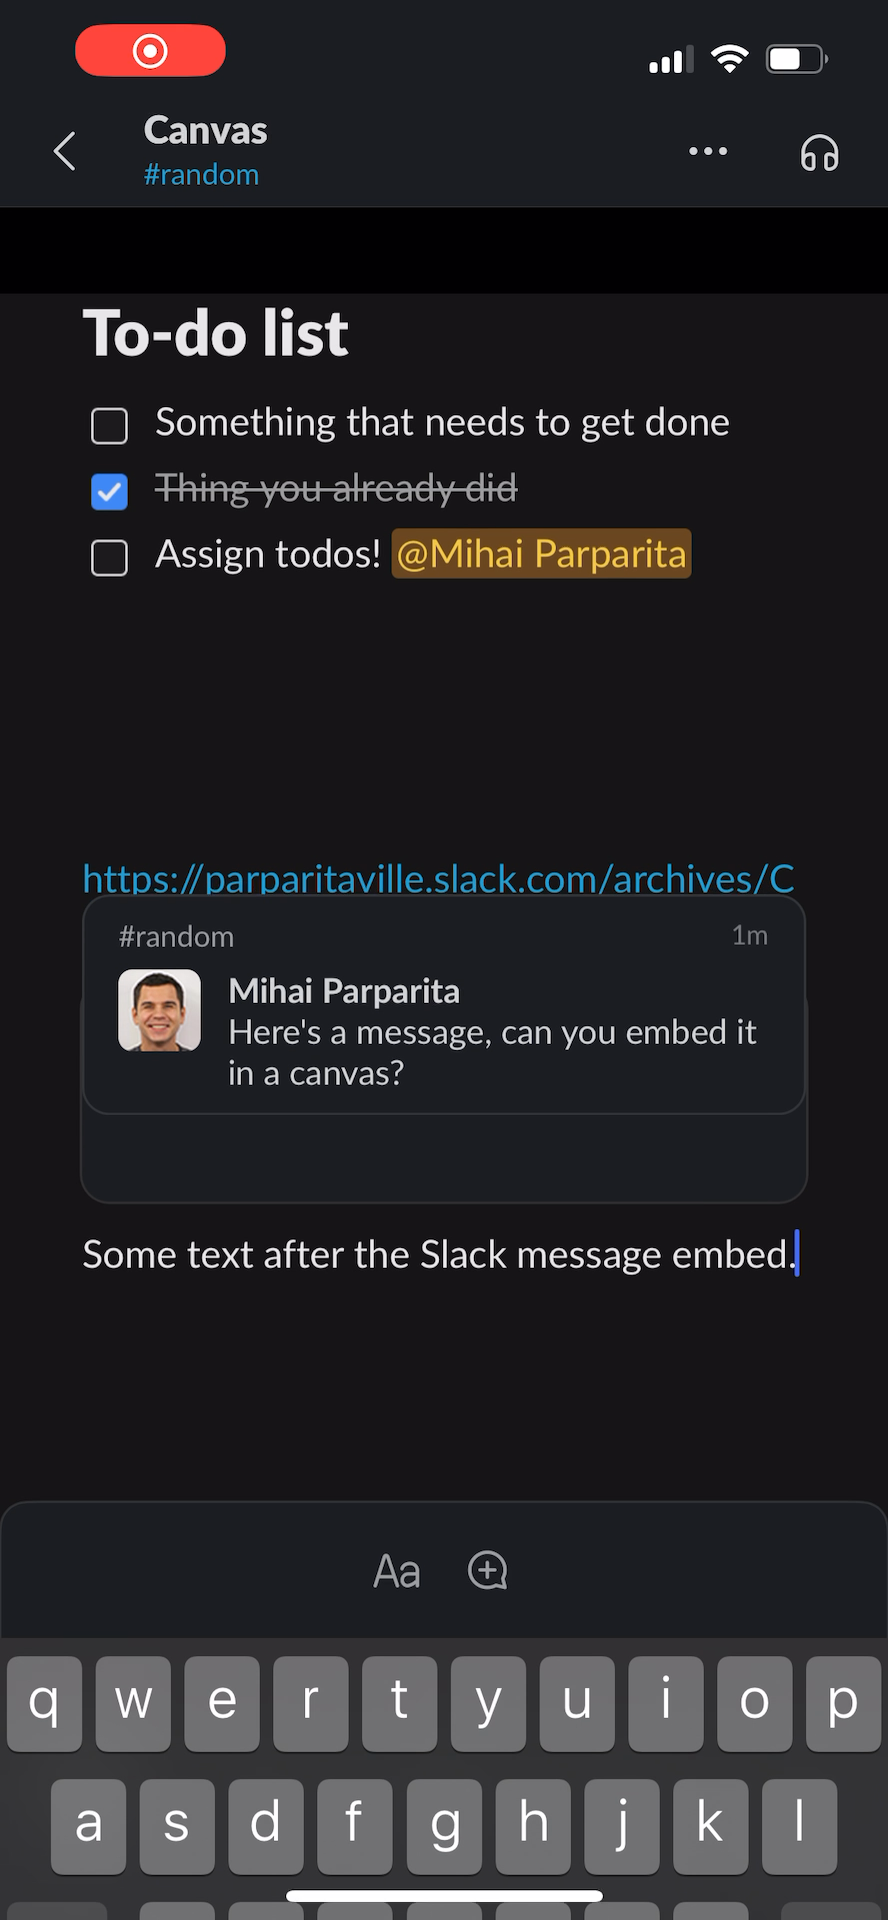
It’s not as easy to inspect the view hierarchy of an iOS app (without jailbreaking), so I can’t verify this directly, but it would appear that this placeholder/overlay approach was indeed chosen. Most of the time, the native Slack UI is positioned perfectly over the document. However, in some edge cases (e.g when a scroll is triggered because the keyboard is being brought up), things end up slightly out of sync, and the placeholder is visible:

Message embed in Slack canvas Offset message embed in Slack canvas, captured during keyboard scroll

This is my first time being on the outside of a project while significant work on it continued (unlike other times), and it’s been fascinating to observe. I congratulate all the people involved in shipping Slack canvas, and will cheer them on3.

  1. I later realized I had done the same thing 15 years earlier, getting Reader iframed into Gmail as another proof-of-concept.
  2. At one point we had slack.com iframing quip.com which in turn was iframing slack.com again (so that we could show Slack UI components inside documents), an architecture we took to calling “turducken.”
  3. Especially if they bring back syntax highlighting for code blocks.

Places Mihai Has Committed Code From #

I've been running lolcommits for 10 years, and it's captured some interesting moments from my time at Quip and Tailscale.

I've put together a gallery, it was a fun nostalgia trip to revisit so many places and coworkers.

The Case of the Missing Equals Sign #

I was recently investigating suspiciously high CPU usage while typing in documents in Quip’s Mac app. We had recently switched to WKWebView, and this was happening in the “web content” process, suggesting that it was a JavaScript-related problem, or perhaps something related to the CSS/HTML layout computation for documents. Further examination showed that this happened even in small or simple documents, thus likely ruling out layout complexity.

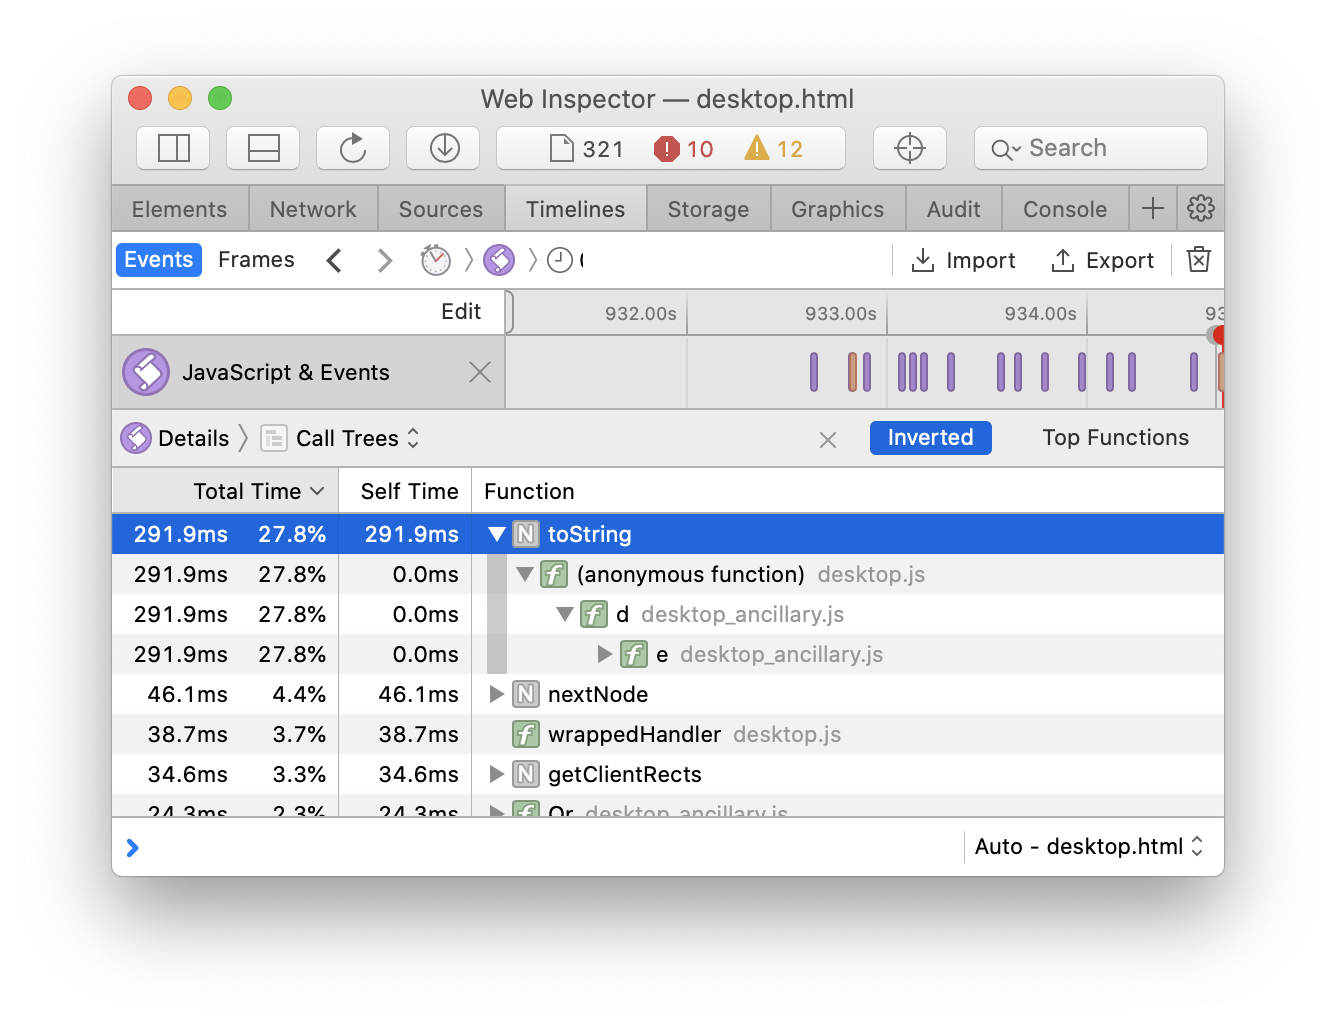
I hooked up the JavaScript profiler in the web inspector’s timeline view (for something so useful, it’s rather buried), and was able to produce this inverted call graph:

JavaScript Profile Results

What was surprising was that the bulk of the time was spent in the native toString function, as opposed to any code that we had authored. However, it was unclear which toString this was (Number’s, Object’s, Date’s, etc.), or who was calling it — this profile is from the minified JavaScript in our production app, and there’s no easy way to get a full stack trace to apply a source map to. While it is possible to work with the minified code directly, especially in a codebase you’re familiar with, I was hoping to avoid that.

Hoping to get more visibility into the calling code, I switched to running the JavaScript in development mode, where the code is un-minified and served directly as ES6 modules (see our recent blog post for more details). Surprisingly, the behavior went away entirely — toString was nowhere near the top functions. While this was no doubt a clue, it didn’t help with understanding the problem directly.

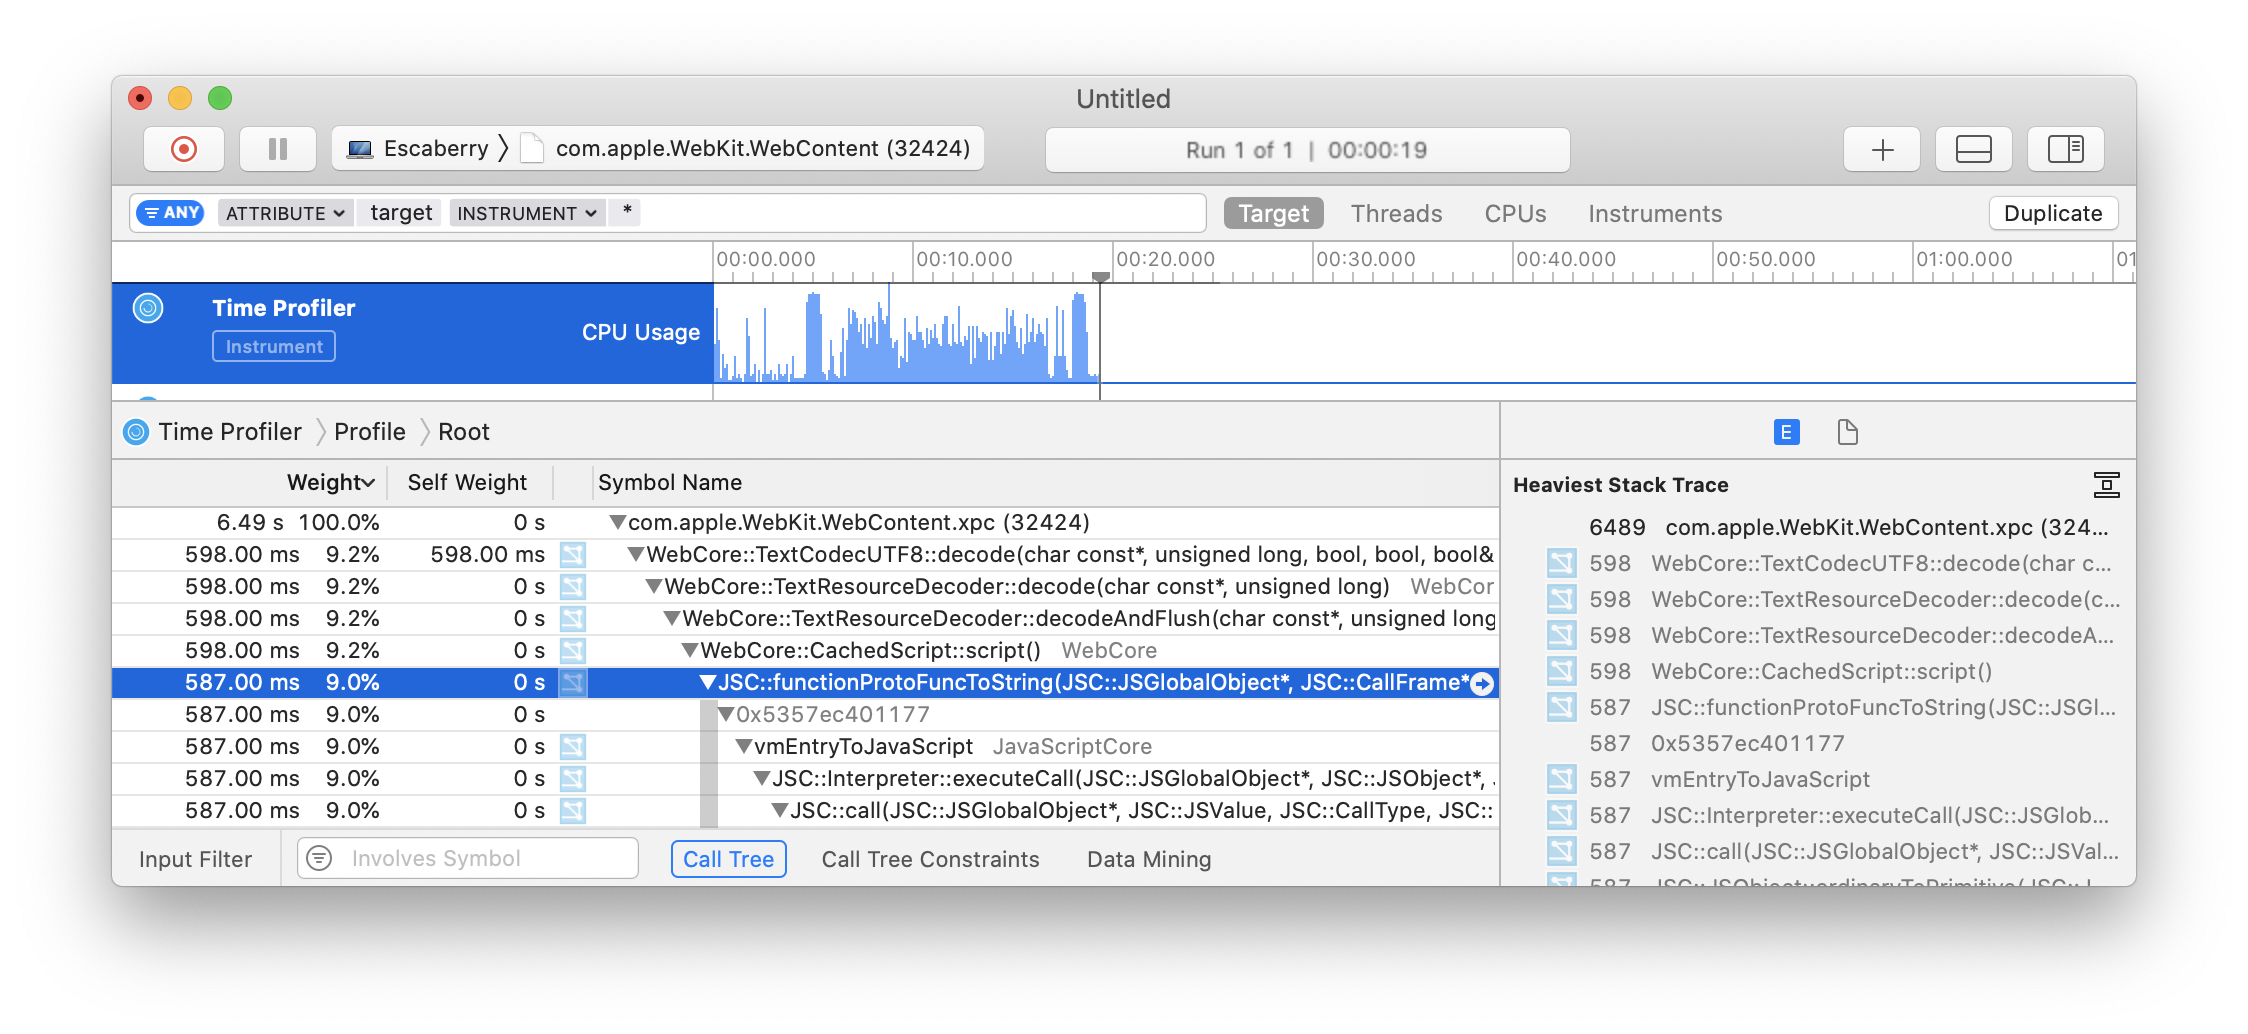
I decided to take a different debugging strategy, and switched to profiling the web content process directly via the Xcode Instruments tool (along the lines of past investigations, it’s possible to determine the PID of the process and attach debugging tools to it).

Instruments Profile Results

Happily, the profile lined up with what I saw on the JS side: a lot of time is spent in a toString function. It’s now possible to see which object’s method this is, and surprisingly, it’s Function’s. Or perhaps it should not be surprising: as specified, it’s supposed to return the source code for the function, which may be an expensive operation. In the WebKit/JavaScriptCore implementation, this ends up doing a substring operation on the entire file’s source (and there appears to be no caching). This explains the difference that was observed when looking at prod vs. development mode — in prod mode there’s a single large (multi-megabyte) file, while in development the function happened to live in a smallish (a few kilobytes) file.

Now that I knew where the problem was, I added a small monkey-patch to see where the stringification was happening:

const originalToString = Function.prototype.toString;
Function.prototype.toString = function () {
    const startTime = performance.now();
    const rv = originalToString.call(this);
    const runTime = performance.now() - startTime;
    console.groupCollapsed(
        `Function.prototype.toString call: ${runTime.toFixed(3)}ms`);
    console.trace();
    console.groupEnd();
    return rv;
};

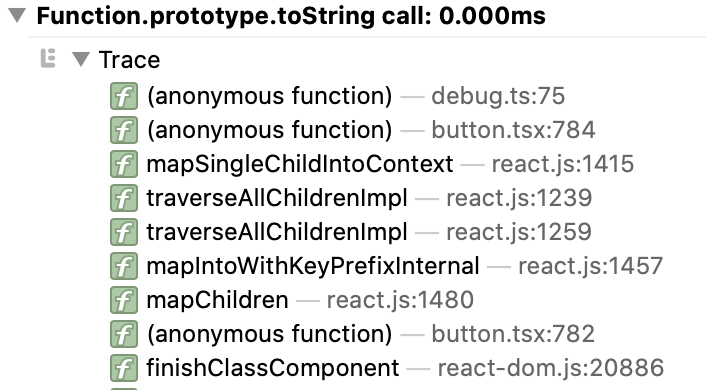
This yielded the following trace:

toString stack trace

Following through on the button.tsx stack frame pointed to a line with an if (button.type != Button) {...} expression. At first glance it does not appear to be doing any string conversions, but that is what the != operator ends up doing. This is because button is a React element, and the type property is either a string (if it’s a built-in DOM element like div or span) or a class/function (if it’s a custom element). Originally, all elements on this code path (which is invoked whenever the user types) were custom elements, thus the != was comparing one function to another. This is fast since it uses reference equality. However, at some point some DOM children were introduced, and we were comparing a string and a function. Since we’re using !=, this is a loose equality comparison, and we end up stringifying the function operand to make it comparable to the string one.

The fix turned out to be trivial: change the comparison to use !== so that strict equality is used. We’ve been preferring strict equality for most new code, but had not enabled the linting rule to enforce it because it’s a slog to work through all of the legacy violations. This experience shows that it’s not just a matter of preferring strict equality to avoid WAT moments, but that there are performance benefits as well.

Update on July 20, 2021: I recently noticed that WebKit has now added a caching performance optimization for Function.prototype.toString, most likely removing this pitfall.

Quip's TypeScript Migration #

Quip did a wholesale migration to TypeScript around this time last year. Now that the dust has settled and we've lived with the consequences for a while, Rafael and I wrote a couple of blog posts about it all: Part one describes the process that we chose, and part two has some anecdotes about how we solved specific problems.

In-Product Debugging Tools #

I wrote a post on the Quip blog about the various in-product debugging tools that we've developed over the years. It's been very satisfying to make and use our tools over the years, I'm glad we're finally sharing some details about them.

Quip Editor Debugging Overlay
One of the many overlays we've created

Accidental DDoSes I Have Known #

A couple of weeks I was migrating some networking code in Quip's Mac app from NSURLConnection to NSURLSession when I noticed that requests were being made significantly more often than I was expecting. While this was great during the migration (since it made exercising that code path easier), it was unexpected: the data should only have been fetched once and then cached.

After some digging, it turned out that we had a bug in the custom local caching system that sits in front our CDN (CloudFront), which we use to serve profile pictures and other non-authenticated data. Due to a catch-22 in the cache key function (which made it depend on the HTTP response), all assets would initially not be found in the local cache, and would incur a network request. The necessary data was then stored in memory, so until the app was restarted the cache would work as expected, but in the next session they would get requested again.

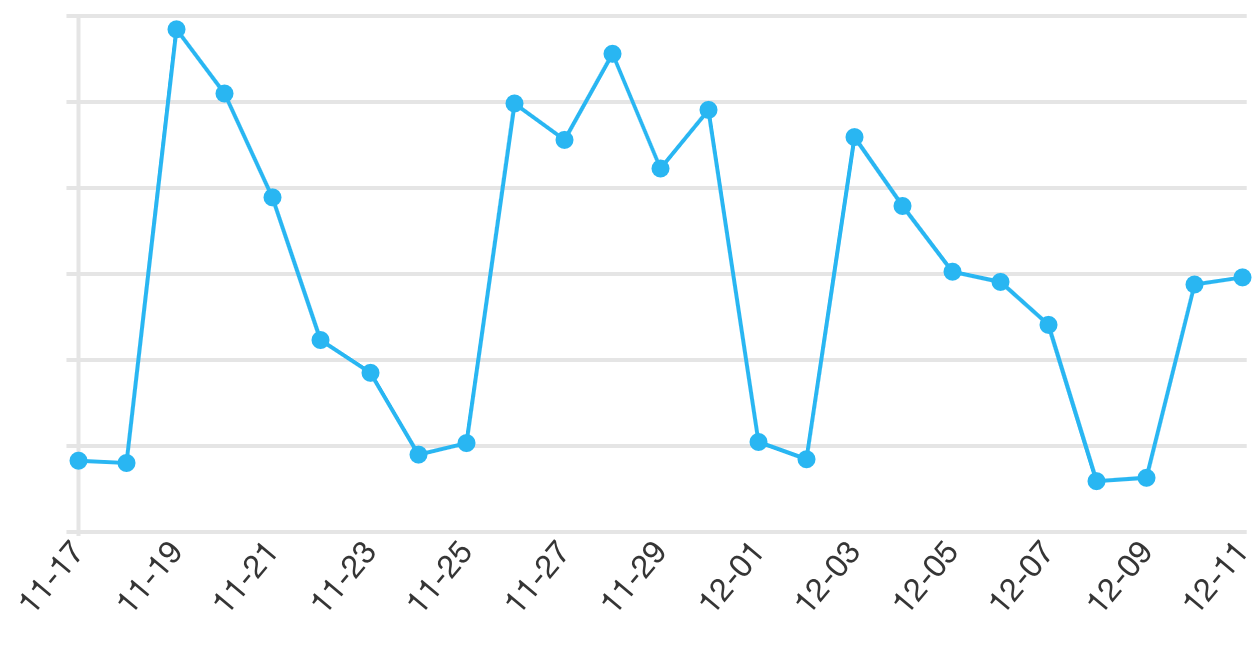
Chart of CloudFront requestsIt turned out that this bug had been introduced a few months prior, but since it manifested itself as a little bit of extra traffic to an external service, we didn't notice it (the only other visible manifestation would be that profile pictures would load more slowly during app startup, or be replaced with placeholders if the user happened to be offline, but we never got any reports of that).

This chart (of CloudFront requests from “Unknown” browsers, which is how our native apps are counted) shows the fix in action; the Mac app build with it was released on November 30th and was picked up by most users over the next few days.

This kind of low-grade accidental DDoS reminded of a similar bug that I investigated a few years ago at Google, while working on Chrome Extensions. A user had reported that the Gmail extension for Chrome (which my team happened to own, since we provided it as sample code) would end up consuming a lot of memory (and eventually be terminated) if the Gmail URL that it tried to fetch data from was blocked by filtering software. After some digging it turned out that the extension would enqueue two retries for every failed failure response, due to code along these lines:

var xhr = new XMLHttpRequest();

... // Send off request

function handleError() {
    ... // schedule another request
}

xhr.onreadystatechange = function() {
    .. // Various early exits if success conditions are met
    
    handleError();
};

xhr.onerror = function() {
   handleError();
};

The readystatechange event always fires, including for error states that also invoke the error event handler. This behavior meant that it would quickly escalate from a request every few minutes to almost one request per second, depending on how long it remained in the blocked state. The fix turned out to be trivial, and since this was a separate package distributed via the Chrome Web Store that gets auto-updated, we could quickly fix the millions of users that had it installed.

It then occurred to me that this would not just affect users where the Gmail URL was blocked, but any user that had spotty connectivity — any HTTP failure would result in a doubling of background requests. I then called up a requests-per-second graph of the Atom feed endpoint for Gmail (which is what the extension used), and saw that it had dropped by 20,000 requests per second over the day or so that it took for the extension update to propagate.

The upshot of all this is that Google Reader at its peak had about 10,000 requests per second, thus making my overall traffic contribution to Google net negative.

Efficiently Loading Inlined JSON Data #

I wrote up a post on the Quip blog about more efficiently embedding JSON data in HTML responses. The tl;dr is that moving it out of a JavaScript <script> tag and parsing it separately with JSON.parse can significantly reduce the parse time for large data sizes.

Understanding WebKit behavior via lldb #

I recently ran into some puzzling WebKit scrolling behavior: child iframes mysteriously causing the main window to get scrolled. This was in the context of a Quip feature still under development, but I've recreated a simple test case for it, to make it easier to follow along. There are two buttons on the page, both of which dynamically create and append an <iframe> element to the page. They convey parameters to the frame via the fragment part of the URL; one button has no parameters and the other does, but they otherwise load the same content. The mysterious behavior that I was seeing was that the code path without parameters was causing the main window to scroll down (such that the iframe is at the top of the visible area).

With such a reduced test case it may already be obvious what's going on, but things were much less clear at the time that I encountered this. There were many possible causes since we had made a major frame-related infrastructure change when this started to happen. The only pattern was that it only seemed to affect WebKit-based browsers (i.e. Safari and especially our Mac app). After flailing for a while, I realized what I wanted most of all was a breakpoint. Specifically, if I could break in whatever function implemented page scrolling, then I could see what the trigger was. Some quick monkey-patching of the scrollTop window property showed that the scrolling was not directly initiated by JavaScript (indeed the bug could be reproduced entirely without JavaScript by inlining the iframe HTML directly). Therefore such a breakpoint needed to be on the native side (in WebKit itself) via lldb.

The first task was to attach a debugger to WebKit. It's been a few years since I've built it from source, and I didn't relish having to wait for the long checkout and build process. Unfortunately, lldb doesn't seem to want to be attached to Safari, presumably because System Integrity Protection (SIP) disallows debugging of system applications. Fortunately, nightly builds of WebKit are not protected by SIP, and they exhibited the same problem. To figure out which process to attach to (web content runs in a separate process from the main application), Apple's documentation revealed the helpful debug option to show process IDs in page title. Thus I was able to attach to the process rendering the problematic page:

$ lldb
(lldb) process attach --pid 15079
Process 15079 stopped
...

The next thing to figure out was what function to break in. Looking at the implementations of scrolling DOM APIs it looked like they all ended up calling WebCore::RenderObject::scrollRectToVisible, so that seemed like a promising choke point.

(lldb) breakpoint set -M scrollRectToVisible
Breakpoint 1: 2 locations.

(the output says that two breakpoints are set, since it also matches WebCore::RenderLayer::scrollRectToVisible, but that turned out to be a happy accident)

After using continue command to resume execution and reproducing the problem, I was very happy to see that my breakpoint was immediately triggered. I could then get the stack trace that I was after:

(lldb) bt
* thread #1, queue = 'com.apple.main-thread', stop reason = breakpoint 1.2
  * frame #0: 0x000000010753eda0 WebCore`WebCore::RenderObject::scrollRectToVisible(WebCore::SelectionRevealMode, WebCore::LayoutRect const&, bool, WebCore::ScrollAlignment const&, WebCore::ScrollAlignment const&)
    frame #1: 0x0000000106b5da64 WebCore`WebCore::FrameView::scrollToAnchor() + 292
    frame #2: 0x0000000106b55832 WebCore`WebCore::FrameView::performPostLayoutTasks() + 386
    frame #3: 0x0000000106b59959 WebCore`WebCore::FrameView::layout(bool) + 4009
    frame #4: 0x0000000106b5d878 WebCore`WebCore::FrameView::scrollToAnchor(WTF::String const&) + 360
    frame #5: 0x0000000106b5d659 WebCore`WebCore::FrameView::scrollToFragment(WebCore::URL const&) + 57
    frame #6: 0x0000000106b39c80 WebCore`WebCore::FrameLoader::scrollToFragmentWithParentBoundary(WebCore::URL const&, bool) + 176
    frame #7: 0x0000000106b389c8 WebCore`WebCore::FrameLoader::finishedParsing() + 120
    frame #8: 0x00000001069d3e0a WebCore`WebCore::Document::finishedParsing() + 266
    frame #9: 0x0000000106bfb322 WebCore`WebCore::HTMLDocumentParser::prepareToStopParsing() + 162
    frame #10: 0x0000000106bfc1b3 WebCore`WebCore::HTMLDocumentParser::finish() + 211
    ...

It looked like WebKit had decided to scroll to an anchor, which was surprising, since I wasn't expecting any named anchors in the document. After reading through the source of WebCore::FrameView::scrollToAnchor I finally understood what was happening:

// Implement the rule that "" and "top" both mean top of page as in other browsers.
if (!anchorElement && !(name.isEmpty() || equalLettersIgnoringASCIICase(name, "top")))
    return false;

As a side effect of the infrastructure change, the frame no longer had any parameters in the fragment part of the URL, but the code that was generating the URLs would always append a #. This empty fragment identifier would thus be marked as requesting a scroll to the top of the document. Once execution continued, we would end up in the previously-mentioned WebCore::RenderLayer::scrollRectToVisible method, which recurses into the parent frame, thus scrolling the whole document.

(lldb) bt
* thread #1, queue = 'com.apple.main-thread', stop reason = breakpoint 1.1
  * frame #0: 0x00000001074e0f80 WebCore`WebCore::RenderLayer::scrollRectToVisible(WebCore::SelectionRevealMode, WebCore::LayoutRect const&, bool, WebCore::ScrollAlignment const&, WebCore::ScrollAlignment const&)
    frame #1: 0x00000001074e143d WebCore`WebCore::RenderLayer::scrollRectToVisible(WebCore::SelectionRevealMode, WebCore::LayoutRect const&, bool, WebCore::ScrollAlignment const&, WebCore::ScrollAlignment const&) + 1213
    frame #2: 0x00000001074e143d WebCore`WebCore::RenderLayer::scrollRectToVisible(WebCore::SelectionRevealMode, WebCore::LayoutRect const&, bool, WebCore::ScrollAlignment const&, WebCore::ScrollAlignment const&) + 1213
    frame #3: 0x000000010753ee55 WebCore`WebCore::RenderObject::scrollRectToVisible(WebCore::SelectionRevealMode, WebCore::LayoutRect const&, bool, WebCore::ScrollAlignment const&, WebCore::ScrollAlignment const&) + 181
    frame #4: 0x0000000106b5da64 WebCore`WebCore::FrameView::scrollToAnchor() + 292
    frame #5: 0x0000000106b55832 WebCore`WebCore::FrameView::performPostLayoutTasks()
    ...

The fix was then trivial (remove the # if no parameters are needed), but it would have taken me much longer to find if I had treated the browser as a black box. As a bonus, reading through the WebKit source also introduced me to the “framesniffing” attack. The guards against this attack explained why the Mac app was most affected. There the main frame is loaded using a file:/// URL and based on WebKit's heuristics it can access any other origin, allowing the anchor scroll request to cross frame/origin boundary.

Disabling the click delay in UIWebView #

Historically, one of the differences that made hybrid mobile apps feel a bit “off” was that there would be lag when handling taps on UI elements with a straightforward click event handler. Libraries such as Fastclick were created to mitigate this by using raw touch events to immediately trigger the event handlers. Though they worked for basic uses, they added JavaScript execution overhead for touch events, which leads to jank.

More recently, both Chrome on Android and Safari on iOS have removed this limitation for pages that are not scalable. That was the fundamental reason why there was a delay for single taps — there was no way to know if the user was trying to do a double-tap gesture or a single tap, so the browser would have to wait after the first tap to see if another came.

I assumed that this would apply to web views embedded within apps, but I was disappointed to see that Quip's behavior did not improve on iOS 9.3 or 10.0 (we have our own Fastclick-like wrapper for most event handlers, but it didn't apply to checkboxes, and those continued to be laggy). Some more research turned up that the improvement did not apply to UIWebView (the older mechanism for embedding web views in iOS apps — WKWebView is more modern but still has some limitations and thus Quip has not migrated to it).

The WebKit blog post about the improvements included some links to the associated tracking bugs (as previously mentioned, WKWebView is entirely open source, which continues to be nice). Digging into one of the associated commits, it looked like this was a matter of tweaking the interaction between multiple UIGestureRecognizer instances. Normally the one that handles single taps must wait for the one that handles double taps to fail before triggering its action. Since the double tap one takes 350 milliseconds to determine if a tap is followed by another, it needs that long to fail for single taps. The change that Apple made was to disable this second gesture recognizer for non-scalable pages.

UIWebView is not open source, but I reasoned that its implementation must be similar. To verify this, I added a small code snippet to dump all gesture recognizers for its view hierarchy (triggered with [self dumpGestureRecognizers:uiWebView level:0]:

-(void)dumpGestureRecognizers:(UIView *)view level:(int)level {
    NSMutableString *prefix = [NSMutableString new];
    for (int i = 0; i < level; i++) {
        [prefix appendString:@"  "];
    }
    NSLog(@"%@ view: %@", prefix, view);
    if (view.gestureRecognizers.count) {
        NSLog(@"%@ gestureRecognizers", prefix);
        for (UIGestureRecognizer *gestureRecognizer in view.gestureRecognizers) {
            NSLog(@"%@   %@", prefix, gestureRecognizer);
        }
    }
    for (UIView *subview in view.subviews) {
        [self dumpGestureRecognizers:subview level:level + 1];
    }
}

This showed that the UIWebView contains a UIScrollView which in turn contains a UIWebBrowserView. That view has a few gesture recognizers, the most interesting being a UITapGestureRecognizer that requires a single touch and tap and has as the action a _singleTapRecognized selector. Sure enough, it requires the failure of another gesture recognizer that accepts two taps (it has the action set to _doubleTapRecognized, which further makes its purpose clear).

<UITapGestureRecognizer: 0x6180001a72a0; 
    state = Possible; 
    view = <UIWebBrowserView 0x7f844a00aa00>; 
    target= <(action=_singleTapRecognized:, target=<UIWebBrowserView 0x7f844a00aa00>)>; 
    must-fail = {
        <UITapGestureRecognizer: 0x6180001a7d20; 
            state = Possible; 
            view = <UIWebBrowserView 0x7f844a00aa00>; 
            target= <(action=_doubleTapRecognized:, target=<UIWebBrowserView 0x7f844a00aa00>)>; 
            numberOfTapsRequired = 2>,
        <UITapGestureRecognizer: 0x6180001a8180; 
            state = Possible; 
            view = <UIWebBrowserView 0x7f844a00aa00>; 
            target= <(action=_twoFingerDoubleTapRecognized:, target=<UIWebBrowserView 0x7f844a00aa00>)>; 
            numberOfTapsRequired = 2; numberOfTouchesRequired = 2>
    }>

As an experiment, I then added a snippet to disable this double-tap recognizer:

for (UIView* view in webView.scrollView.subviews) {
    if ([view.class.description equalsString:@"UIWebBrowserView"]) {
        for (UIGestureRecognizer *gestureRecognizer in view.gestureRecognizers) {
            if ([gestureRecognizer isKindOfClass:UITapGestureRecognizer.class]) {
                UITapGestureRecognizer *tapRecognizer = (UITapGestureRecognizer *) gestureRecognizer;
                if (tapRecognizer.numberOfTapsRequired == 2 && tapRecognizer.numberOfTouchesRequired == 1) {
                    tapRecognizer.enabled = NO;
                    break;
                }
            }
        }
        break;
    }
}

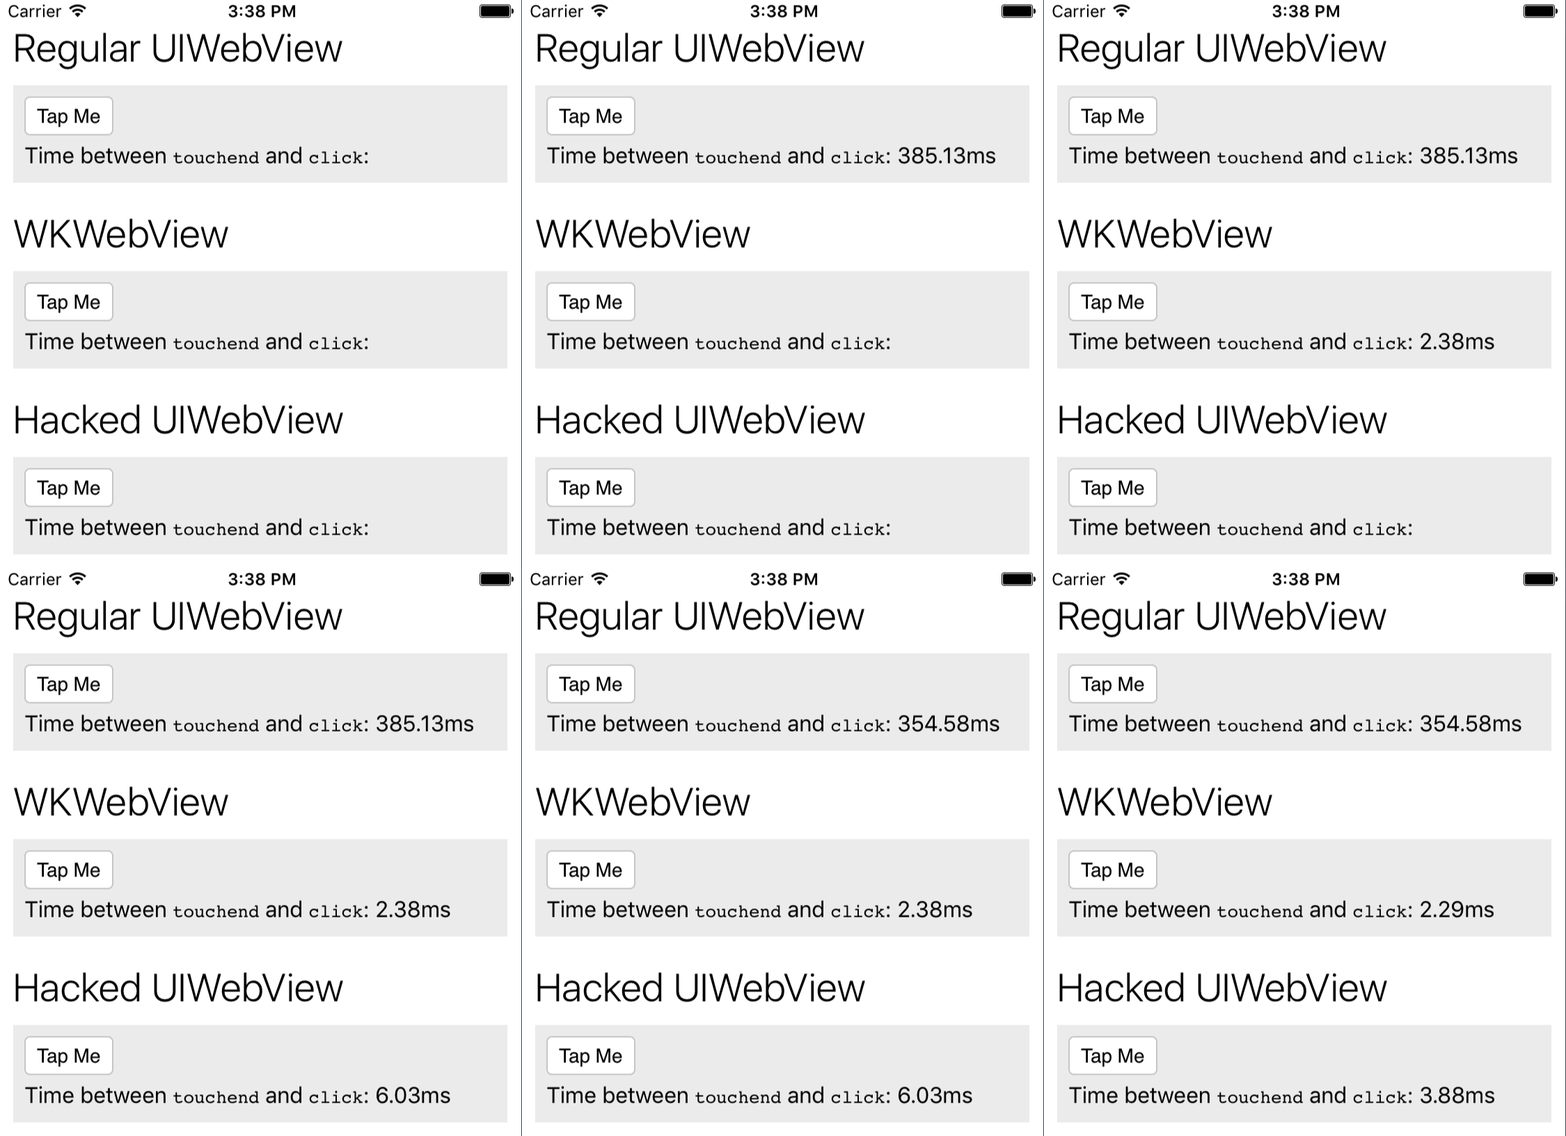
Once I did that, click events were immediately dispatched, with minimal delay. I've created a simple testbed that shows the difference between a regular UIWebView, a WKWebView and a “hacked” UIWebView with the gesture recognizer. Though the WKWebView is still a couple of milliseconds faster, things are much better.

Touch delay in various web views

Note that UIWebBrowserView is a private class, so having a reference to it may lead to App Store rejection. You may want to look for alternative ways to detect the gesture recognizer. Quip has been running with this hack for a couple of months with no ill effects. My only regret that is that I didn't think of this sooner, we (and other hybrid apps) could have had lag-free clicks for years.

Perils of Measuring Long Intervals with Performance.now() #

I recently ran into an interesting quirk when using Performance.now() to measure long-ish intervals in Quip's web app. Since it does not seem to be broadly known, I thought I would document it.

To mitigate the possibility of self-induced DDoS attacks, I recently added duplicate request detection to Quip's model layer data loading mechanism. Since we pretty aggressively cache loaded data, repeated requests for the same objects would indicate that something is going wrong. I therefore added a client-side check for the exact same request being issued within 60 seconds of the first occurrence. If it triggered, it would send a diagnostic report to our error tracking system.

This turned up some legitimate bugs (e.g. two independent code paths racing to trigger loads) as well as some false positives (e.g. retries of requests that failed should be allowed). After pushing the fixes and tweaks to the detection system, I was left with a few puzzling reports. The report claimed that a duplicate request had occurred within a very short interval, but based on other events it looked like the requests had been several minutes (or even hours) apart.

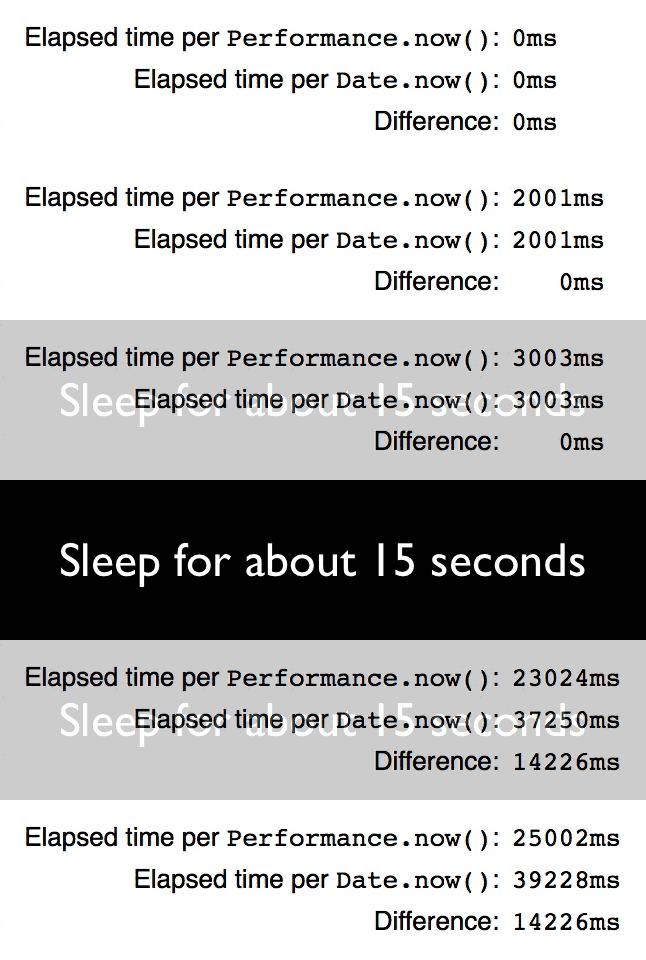
When I looked at the reports more carefully, I saw that the long time interval was always bracketed by a disconnect and reconnect of the Web Socket that we use for sending real-time updates. I hypothesized that this may have been a laptop whose lid was closed and later re-opened. Taking a look at how I measured elapsed time between requests, I saw that this was computing the delta between to high-resolution timestamps returned by Performance.now(). I was then able to reproduce this scenario locally by comparing wall-clock elapsed time with high resolution elapsed time while my computer was asleep (to see it in action, see this simple test bed). I initially did this in Chrome, but Safari and Firefox seem to have the same behavior.

Performance.now() behavior across sleep intervals

The fix was switch to using Date.now(), which otherwise worked equally well for this use-case. We didn't actually need the high-resolution guarantees of Performance.now() — the reason why it was used in the first place is because the code already had a timestamp with it in place that was used for measuring load request-to-response time. The same code runs in on our desktop app (where load times can be sub-millisecond) and so the high resolution was needed for that use case.

I am definitely not the first to run into this; I have found a few off-hand mentions of this behavior. For example, see this Stack Overflow comment and this post on elm-dev. Curiously, neither the currently published version of the time specification nor the latest draft seem to indicate that this may be a possibility. Per the spec, Peformance.now() is supposed to return the difference between the time of the call and the time origin, and presumably the origin is fixed.

As to the specifics of why this happens, I spelunked through Chrome's codebase a bit. The Performance.now implementation calls monotonicallyIncreasingTime which uses base::TimeTicks::Now which uses the CLOCK_MONOTONIC POSIX clock. I wasn't able to find any specific gotchas about macOS's implementation of that clock, but Apple does have a tech note that says that “timers are not accurate across a sleep and wake cycle of the hardware” so this is not a surprise at that low level. Within the Chrome project it is also known that base::TimeTicks is unreliable across sleep intervals. Though it's common to think of the browser environment as being very high level and abstracted away from the hardware and operating system, small nuances such as this one do sometimes leak through.

Avoiding Incremental Rendering in Hybrid Desktop Apps #

I previously described how adding native popovers and modal dialogs to Quip’s hybrid desktop apps helped them to blend in and avoid the “uncanny valley” of web-based apps that don’t quite feel right. Another area that we focused on was the experience of creating a new window, especially during application startup. This is the first impression for a user, and thus informs how they will perceive the rest of the app.

In theory launching should be fast — not much happens when a new window is created:

  1. An NSWindow is instantiated.
  2. A WebView is added to the window.
  3. The web view is directed to load the HTML file from the app’s bundle. That file serves as the “shell” for the HTML, JavaScript and CSS that are used for the UI.
  4. Once a signal from the JS that it has been initialized is received, the native side instructs it to render the desktop (or other initial object, when restoring the previous application state).

Here’s a short screen recording showing the application launch sequence for a small account:

End-to-end it doesn’t feel too slow, but there’s a lot of flashing and incremental rendering of the UI, which definitely feels “webby” as opposed to native. To make it a bit easier to understand what is going on, here’s a version that has been slowed down¹ by a factor of 3:

The visual progression can be broken down into 4 stages:

  1. Blank window appears
  2. Basic app “chrome” appears (without any user data)
  3. Data and images begin to appear
  4. Rendering is complete

In a native app, none of the intermediate stages are visible, thus they have much of a “snappy” feeling when creating a new window. Incremental rendering is normally desirable on the web if waiting on resources that require a network round-trip. In this case the overall time is short enough that intermediate states which only appear for a few frames (such as the one shown below) are distracting rather than giving a sense of progress.

Intermediate state

To avoid showing an entirely blank window (stage 1), instead of showing the window immediately, we modified the new window sequence to keep the window hidden until the ReactDOM.render() call for the application’s root view finished. This does mean that there is a slightly longer delay between the app being launched and the window appearing. However, since other things are happening (dock icon bouncing, menu bar changing), and the delay is on the order one to two hundred milliseconds, it's not noticeable.

The initial rendered view was very empty since it didn’t have any of the data for the user’s desktop or inbox. On the web we “seed” this data in the initial HTML response to avoid the extra network round-trip to fetch it. We had assumed that loading data from the local database is so fast that such an optimization was unnecessary, and instead it could be loaded on demand like everything else. It was indeed quite fast, but it still took tens of milliseconds, which led to frames that appeared incomplete. Once we added the same “seeding” capability to the desktop app (the request to render the initial object also included all the data necessary for the view), almost everything appeared at once, skipping over most of stage 3.

The reason why I said almost everything appeared at once is because some images were still taking a few extra frames to show up. The odd part was that these images were local static assets, and thus should have been readily available (e.g. the folder and sidebar icons in the screenshot above). Further, we inline the images as data: URIs into our main stylesheet (an optimization originally meant for the website, but carried over to the desktop app since it didn’t seem like it would hurt). Thus loading of the images should not involve any more I/O once the stylesheet was loaded and parsed. Evidently that was not the case — even when using data: URIs there was an asynchronous “fetch” and decompress step for rendering the image.

When experimenting with creating additional windows, we noticed that in those cases the images do appear instantaneously. We thus concluded that they must still end up in WebKit’s memory cache. We wanted to simulate this behavior for even the first window, and in the absence of an explicit cache hinting API, we added a “cache warmer” to invoke early on during application startup. It creates a WebView and loads a simple static HTML file that references our stylesheet and has dummy markup corresponding to our most common views. The view doesn’t need to be added to a window or otherwise shown, and it gets disposed of 10 seconds after startup.

Once all those changes are implemented no incremental rendering is visible (slowed down version). None of modifications that were necessary were particularly complex, but they do show the extra attention to detail that is necessary to get a hybrid web app to feel more native.

  1. During development I often end up taking screen recordings and then stepping through them frame-by-frame to get a better understanding of the rendering sequence. I usually use ScreenFlow, but QuickTime Player can do this too.

Grafting Local Static Resources onto Production #

tl;dr: Using the webRequest Chrome extension API it is possible to “graft” development/localhost JavaScript and CSS assets on a production web service, thus allowing rapid debugging iteration against real production data sets. Demo site and extension.

During the summer of 2015 I was investigating an annoying bug in Quip where our message list would not stay “bottom-anchored” in some circumstances¹. Unfortunately I was only able to trigger it on our live production site, not on my local development setup. Though Chrome’s developer tools are quite nice, I did not have the necessary ability to rapidly iterate on the code in order to further investigate the bug. I had in the past pushed alternate builds our staging site to debug such production-only issues, but that would still take several minutes to see the results of every change.

My next thought was that I could instead try to reproduce the bug in our soon-to-be-released desktop app. The app can use local (minimally processed) JavaScript while running against production data. Unfortunately the bug did not manifest itself in our Mac app. I chalked this up to rendering engine differences (the bug was only visible in Chrome, and our Mac app uses a WebKit-backed WebView). I then tried our Windows app (which uses the same rendering engine as Chrome via the Chromium Embedded Framework), but it didn’t happen there it either. I was forced to conclude that the bug was due to some specific behavior in our website when running against production data, not something in the shared React-based UI.

As I was wishing for a way to use JavaScript and CSS from my laptop with production data (for security reasons my local Quip server cannot connect to the production databases) I remembered that Gmail used to have exactly such a mode. As I recall it, you could start a local CaribouGmail server, go to your (work) Gmail instance and append a special URL parameter that would cause the JavaScript from the local server to be requested instead². With most of Gmail’s behavior being driven by the client-side JavaScript (with the server serving as an API endpoint) this meant that it was possible to try out pretty complex changes on your own data without having to “deploy” them.

I considered adding this mode to Quip, but that seemed scary, security-wise, since it was effectively intentional cross-site scripting. It also would have meant waiting for the next day’s production push (and I wanted to solve the problem as soon as possible). However, it then occurred to me that I didn’t actually need to have the server change it behavior; I could instead write a Chrome extension which (via the webRequest API) would “graft” the local JavaScript and CSS files from my local server onto the production site when loaded in my browser.

I had hoped that the extension could modify the HTML that is initially served and replace the JavaScript and CSS URLs, but it turns out the webRequest API cannot modify the HTTP response body. What did work was to intercept the JavaScript and CSS requests before they were sent to our CDN and redirect them to paths on my local server. Chrome would initially flag this as being insecure (since we use HTTPS in production, and the redirected URLs were over plain HTTP), but it is possible to convince it to load the resources anyway.

Once I had the necessary tooling and ability to iterate quickly, fixing the bug that prompted all this was pretty straightforward (it was caused by the “mount point” system that we used to incrementally migrate our website to React, but that’s a whole other blog post). Since then it’s come in handy in debugging other hard-to-recreate problems, and for measuring JavaScript performance against more realistic data. It did briefly break when we added a Content Security Policy (CSP) — since we were loading scripts from an unknown domain the browser was correctly blocking the “grafted” response. However, the webRequest API also allows the extension to edit the response headers, thus it was straightforward to have it intercept the main HTML page request and strip the CSP header.

The extension that I wrote to accomplish this is very barebones and hardcodes a bunch of Quip-specific logic and URLs, thus is not easily shared. However, I have recreated a simplified version of it and put it in my web experiments repository. There is also a demo site that it can be applied to.

  1. Yet more developer time spent faking something that should be a built-in capability, further confirming Bret’s observation.
  2. For a bit more history: back in 2005 I was using Greasemonkey to hack Gmail left and right. When I talked to the Gmail team about this approach (versus working in my 20% time to add those features to Gmail directly) I rationalized it as “Greasemonkey lets me do UI experiments on the real email in my account with minimal lag, instead of needing to wait for code reviews and production pushes.” Darick Tong (a Gmail engineer) took this feedback to heart and added the custom JavaScript mode. Unfortunately by that point I had mostly moved on from Gmail hacking (Reader was keeping me plenty busy, JavaScript-wise), so I never got to actually use it.

Multiple Windows in Hybrid React Desktop Apps #

Quip’s desktop apps are hybrid apps: both the Windows and Mac apps are composed of a web React-based UI talking to our C++ Syncer library, along with some platform-specific glue code. While this allows us to support two additional platforms with a small team we knew that architecting the apps in this way would run the risk of not “fitting in” with other Mac OS X or Windows applications.

To see if we could mitigate this problem, we started to enumerate what makes an app feel like “just a web view.” There were obvious things like responsiveness, working offline, and using platform conventions (e.g. a menu bar on the Mac). After thinking about it more, we also observed that native apps often have multiple windows, whereas web apps are bound to a single browser tab. This wasn’t just a matter of multiple windows showing Quip documents (something that did not seem too difficult to accomplish), but also all of the child windows that a native app would have (especially popovers and sheets on Mac OS X).

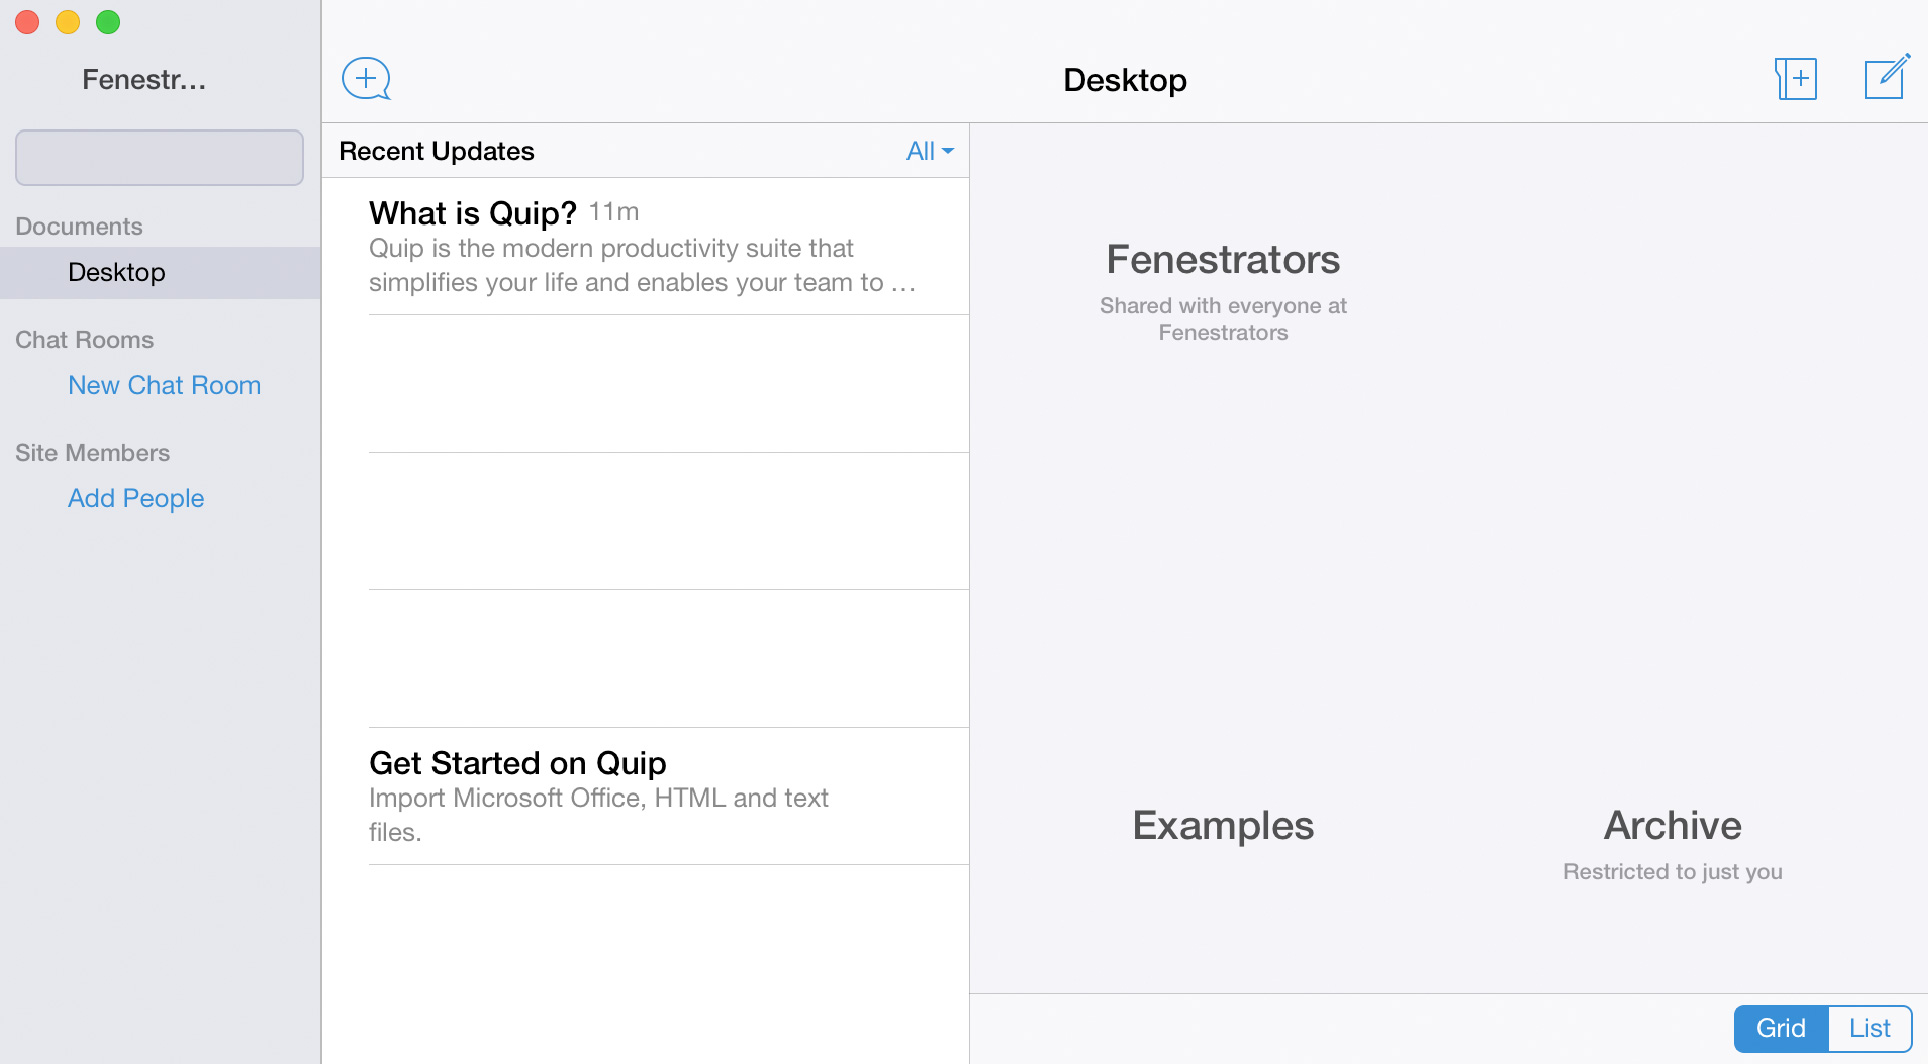
Quip popover on the web site We did have equivalents in our React “parts” library that we used in our website, but visually they didn’t match the native versions, and they felt very much bound by the enclosing rectangle of the web view. This was especially apparent with popovers that were triggered near the edge of the web view; one would expect them to “spill out” of the window but instead they would awkwardly position themselves “inward” to avoid getting clipped by the edges. This triggered an “uncanny valley” effect where the illusion of a native app would be broken.

All of this was very much on my mind about a year ago as I was building up the foundations of our desktop apps. Though seemingly just a “polish” kind of detail, it seemed like supporting child windows would require some design trade-offs that would be easier to make early on, rather than retrofit later. My first thought was that we should define all of the popover and dialog content in a very declarative manner, thus allowing to later change how they were rendered. For modal dialogs this worked pretty well, since their content tended to be pretty simple.

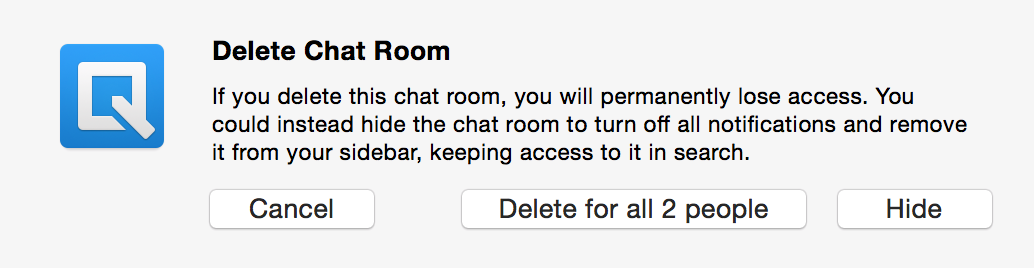
For example, a deletion confirmation dialog would be represented as:

parts.spec.newPanel()
    .addSection(parts.spec.newTitleSection(_("Delete Chat Room")))
    .addSection(parts.spec.newSection()
        .addMessage(_("If you delete this chat room, you will…")))
    .addSection(parts.spec.newSection()
        .addDefaultButton(_("Hide"), function() {
            ...
        })
        .addButton(_("Delete for all %(count)s people", {"count": count}), function() {
            ...
        })
        .addCancelButton(_("Cancel"), function() {}))

It was then a pretty straightforward mapping to generate an NSAlert instance that would fit right in on a Mac app (we support multiple modal dialog “runners”: one that creates a React version and another that passes it off to the platform native code).

Native alert dialog

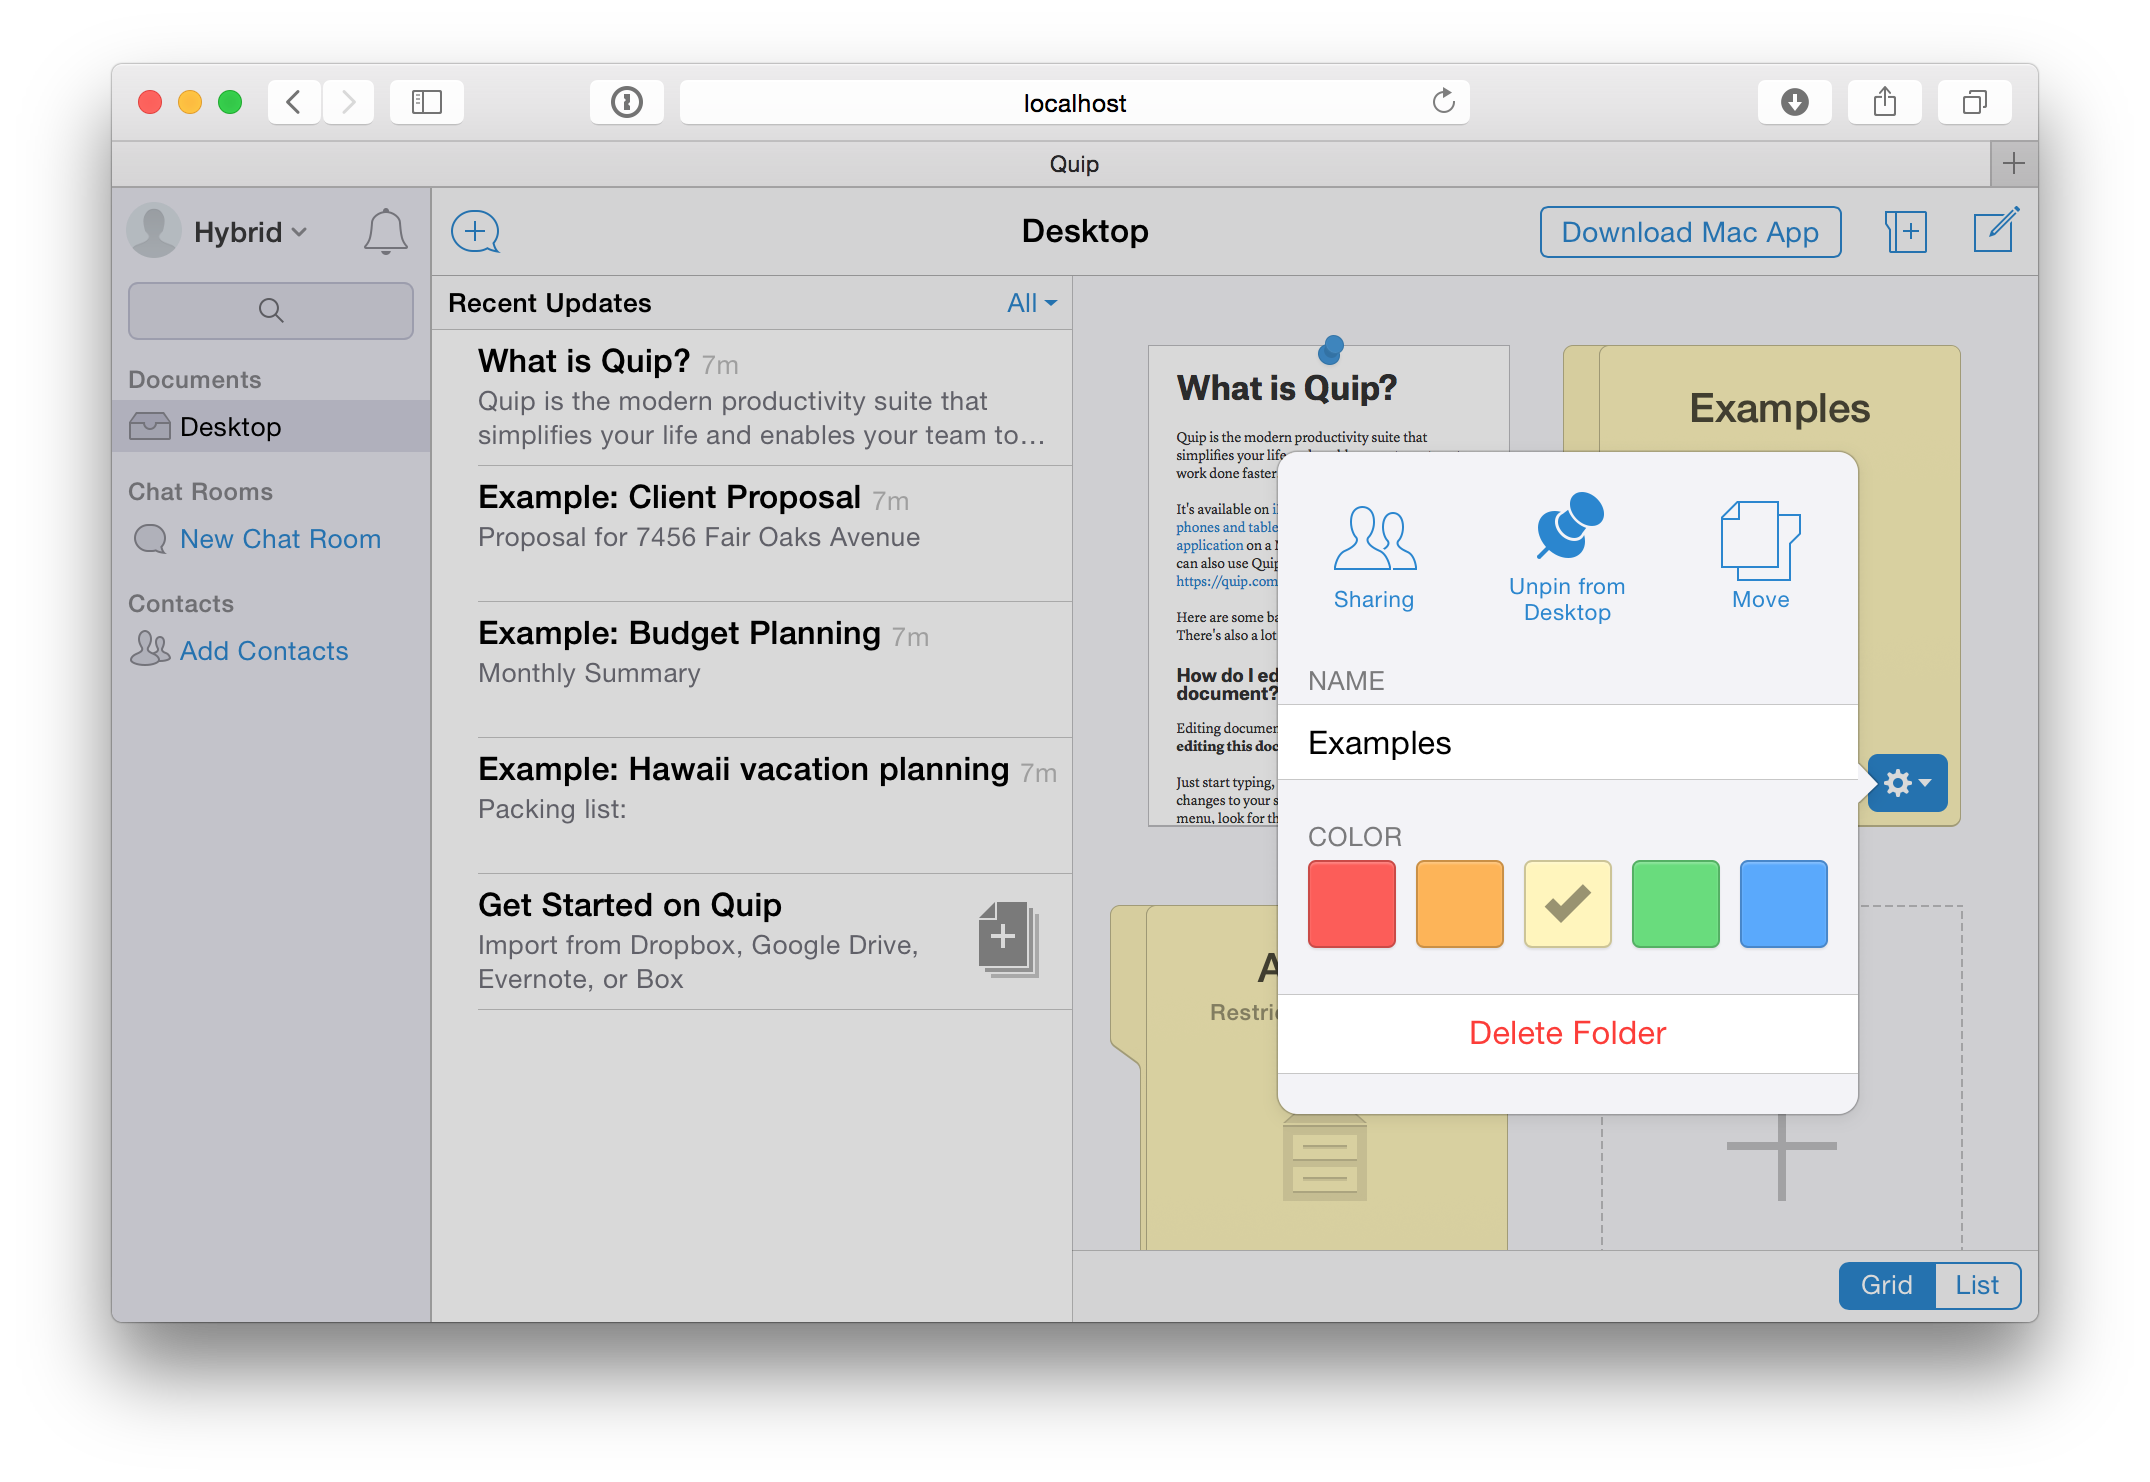
However, once we began to implement more and more popovers, the sheer variety of the kinds of controls used within them became apparent.

Popovers used in Quip

In addition to all these widgets popovers also often had custom validation logic (e.g. the “Create” button in the “New Folder” popovers is grayed out while the title is empty) and dynamic updates (rows representing users show presence). A declarative system would need to be quite complex in order to support all of these concepts. Furthermore, implementing each control multiple times was going to slow down development significantly, and the benefits seemed minimal (for example there are no platform conventions to follow for how to show a user row — that is a Quip-specific concept).

Since we already had a separation between the content of popovers and their frames (indeed, any React-based popover could be shown in a modal dialog instead), I wondered if it was possible to show the contents in a separate web view contained within an NSPopover instead. That way the frame would be native, and it could be positioned outside the main web view, but we would not have to re-implement all of our widgets.

To see if such an approach was feasible, I needed to answer two questions: “Could React render into another window?” and “Could we create another web view that was visible in the main window's JavaScript context?”

The reason why I wanted React to render into another window from the child was that this way all JavaScript execution would still happen in a single window, which would make this code path much more similar to regular popover rendering. To test this out, I tried something along these lines (in the web version of the app):

var otherWindow = window.open();
var container = otherWidow.document.createElement("div");
otherWindow.document.body.append(container);
ReactDOM.render(<parts.PanelContents .../>, container);

To my pleasant surprise this worked (see a simple test harness here), including event handlers (that would be invoked for events in the child window, but the handler would run in the parent window). It turned out that the React team had added support for rendering into other windows quite early, though they had iframes in mind. The only (in retrospect obvious) gotcha was that the child window also needed to have the stylesheet injected into it.

I then turned to the second question — was it possible to intercept the window.open() call when running in the native app and create a popover instead? Since the call seemingly did nothing, I assumed that it was up to the application to handle it. After going through the 6 delegates that WebView supports I came across the webView:createWebViewWithRequest: method of WebUIDelegate. That was indeed invoked for window.open calls, and it was up to the application to create the child WebView and put it somewhere in the view hierarchy. Thus it was a matter of creating the view, a view controller to own it, and setting that as the contentViewController of a NSPopover that was also created then. I’ve created a simple Xcode project that shows all of the pieces working together.

Once I had determined that there were no fundamental roadblocks, a bunch more supporting code was necessary (e.g. for passing around the popover anchor bounds and content size to the native side and for notifying the JS side that a popover was dismissed), but no more showstopper issues appeared. The same “runner” concept was used to allow popovers to be shown in a React frame on the web but a native frame on the Mac (Windows does not have a native popover container window and we have not yet implemented a custom version there).

Quip popover on the web site As I was wrapping up, I was reminded of a Chrome tech talk that I had watched in early 2010 when I was first joining the Chrome team. A surprising amount of time (i.e. greater than 0 in a 30 minute overview talk) was spent discussing the implementation details of <select> popup menu rendering. I hadn’t really thought of select menus as being a particularly tricky part of HTML to implement, but the fact that they extend outside of the main window led to extra layers in the class hierarchy (RenderWidget vs. RenderView) as well as other complexity. Just as most web developers don’t really think about <select> as being all that special, I’m sure most of our users don’t think twice about our popovers sticking out outside of the main window. However, every time I open one I think of all of the things that had to be wired up for it appear the way it does and I smile a little bit.

WKWebView Communication Latency Revisited #

Earlier this year I posted about WKWebView communication latency and how it’s not quite as good as UIWebView (when using WKScriptMessageHandler, the officially sanctioned mechanism). There have a been a few developments in this area, so an update seems warranted.

Things appear to be promising for iOS 9: In late June Mark Lam fixed ScriptMessageHandlerDelegate::didPostMessage to reuse JSContext instances across calls. Now that I had an Apple engineer to bug appeal to, I filed a bug asking for same fix to be applied to [WKWebView evaluateJavaScript:completionHandler:], to help with execution round trips. Mark kindly obliged, and the fix was picked up (merged?) for iOS 9 beta 4.

Earlier, in April, Ted Suzman emailed me to ask if I’d considered modifying document.title to send data from the JS side (since it’s mirrored on the native side as the title property on the WKWebView, which can be observed via KVO). I implemented this approach and it seemed to work quite well. Ted also suggested trying location.replace (instead setting location.hash), which (though it should be equivalent) ends up being slightly faster for both UIWebView and WKWebView (implementation).

Ted’s messages got me thinking about other WKWebView properties that could be manipulated from the JS side, and so I took a closer look at the delegate protocols. The webView:runJavaScriptAlertPanelWithMessage:initiatedByFrame:completionHandler: method on WKUIDelegate caught my eye. We don’t use window.alert() in Quip, but this seemed like it would provide a way of getting a string from JS to native with minimal overhead (as previously mentioned, Quip encodes all JS ↔ native communications as strings already, so we don’t want the web view to do any other serialization for us). Better yet webView:runJavaScriptTextInputPanelWithPrompt:defaultText:initiatedByFrame:completionHandler: (which maps to window.prompt()) allows the native side to return a value to the JS side. I implemented these two approaches too.

Here are the results from testing the various communication mechanisms using my test bed. Tests were run on iPad Air 2’s, one running iOS 8.4 and another running iOS 9.0 beta 5

Method/OS iOS 8.4 iOS 9.0 beta 5
UIWebView
location.hash 0.26 0.28
location.replace 0.18 0.18
WKWebView
WKScriptMessageHandler 2.94 0.63
location.hash 0.69 0.58
location.replace 0.46 0.51
document.title 0.57 0.63
window.alert() 0.42 0.46
window.prompt() 0.37 0.45
JS execution round-trip
UIWebView 0.17 0.16
WKWebView 2.60 0.39

Quip is still using UIWebView since we’re still supporting iOS 7 (and supporting both web views did not seem like it would be worth the complexity). However, once iOS 9 is released we will most likely drop iOS 7 support, so it’s good to know that switching to WKWebView will not pose an unreasonable latency burden (though it remains to be seen if the selective swizzling and subview spelunking that we do will carry over).

Teaching the Closure Compiler About React #

tl;dr: react-closure-compiler is a project that contains a custom Closure Compiler pass that understands React concepts like components, elements and mixins. It allows you to get type-aware checks within your components and compile React itself alongside your code with full minification.

Late last year, Quip started a gradual migration to React for our web UI (incidentally the chat features that were launched recently represent the first major functionality to be done entirely using React). When I started my research into the feasibility of using React, one of my questions was “Does it work with the Closure Compiler?” At Quip we rely heavily on it not just for minification, but also for type annotations to make refactorings less scary and code more self-documenting¹, and for its many warnings to prevent other gotchas in JavaScript development. The tidbits that I found were encouraging, though a bit sparse:

  • An externs file with type declarations for most of React's API²
  • A Quora post by Pete Hunt (a React core contributor) describing React as “closure compiler compatible”
  • React's documentation about refs mentions making sure to quote refs annotated via string attributes³

In general I got the impression that it was certainly possible to use React with the Closure Compiler, but that not a lot of people were, and thus I would be off the beaten path⁴.

My first attempt was to add react.js (the unminified version) as source input along with a simple “hello world” component⁵. The rationale behind doing it this way was that, if React was to be a core library, it should be included in the main JavaScript bundle that we serve to our users, instead of being a separate file. It also wouldn't need an externs file, since the compiler was aware of it. Finally, since it was going to be minified with the rest of our code, I could use the non-minified version as the input, and get better error messages. I was then greeted by hundreds of errors and warnings which broadly fell into three categories:

  1. “illegal use of unknown JSDoc tag providesModule” and similar warnings about JSDoc tags that the React source uses that the Closure Compiler didn't understand
  2. “variable React is undeclared” indicating that the Closure compiler did not realize what symbols react.js exported, most likely because the module wrapper that it uses is a bit convoluted, and thus it's not obvious that the exported symbols are in the global scope
  3. “dangerous use of the global this object” within my component methods, since the Closure Compiler did not realize that the functions within the spec passed to React.createClass were going to be run as methods on the component instance.

Since I was still in a prototyping stage with React, I looked into the most minimal set of changes I could do to deal with these issues. For 2, adding the externs file to our list helped, since the compiler now knew that there was a React symbol and its many properties. This did seem somewhat wrong, since the React source was not actually external, and it was in fact safe to (globally) rename createClass and other methods, but it did quieten those errors. For 1 and 3 I wrote a small custom warnings guard that ignored all “errors” in the React source itself and the “dangerous use of global thiswarning in .jsx files.

Once I did all that, the code compiled, and appeared to run fine with all the other warnings and optimizations that we had. However, a few days later, as I was working on a more complex component, I ran into another error. Given:

var Comp = React.createClass({
    render: function() {...},
    someComponentMethod: function() {...}
});
var compInstance = React.render(React.createElement(Comp), ...);
compInstance.someComponentMethod();

I was told that someComponentMethod was not a known property on compInstance (which was of type React.ReactComponent — per the externs file). This once again boiled down to the compiler not understanding that the React.createClass construct (i.e. that it defined a type). It looked like I had two options for dealing with this:

  1. Add a @suppress {missingProperties} annotation at the callsite, so that the compiler wouldn't complain about the property that it didn't know about
  2. Add a @lends {React.ReactComponent.prototype} annotation to the class spec, so that the compiler would know that someComponentMethod was indeed a method on components (this seemed to be the approach taken by some other code I came across).

The main problem with 2 is that it then told the compiler that all component instances had a someComponentMethod method, which was not true. However, it seemed like the best option, so I added it and kept writing more components.

After a few more weeks, when more engineers started to write React code, these limitations started to chafe a bit. There was both the problem of having to teach others about how to handle sometimes cryptic error messages (@lends is not a frequently-encountered JSDoc tag), as well as genuine bugs that were missed because the compiler did not have a good enough understanding of the code patterns to flag them. Additionally, the externs file didn't quite match with the latest terminology (e.g. React.render's signature had it both taking and returning a ReactComponent). Finally, the use of an externs file meant that none of the React API calls were getting renamed, which was adding some bloat to our JavaScript.

After thinking about these limitations for a while, I began to explore the possibility of creating a custom Closure Compiler pass that would teach it about components, mixins, and other React concepts. It already had a custom pass that remapped goog.defineClass calls to class definitions, so teaching it about React.createClass didn't seem like too much of a stretch.

Fast forward a few weeks (and a baby) later, and react-closure-compiler is a GitHub project that implements this custom pass. It takes constructs of the form:

var Comp = React.createClass({
    render: function() {...},
    someComponentMethod: function() {...}
});

And transforms it to (before any of the normal compiler checks or type information was extracted):

/**
 * @interface
 * @extends {ReactComponent}
 */
function CompInterface() {}
CompInterface.prototype = {
    render: function() {},
    otherMethod: function() {}
};
/** @typedef {CompInterface} */
var Comp = React.createClass({
    /** @this {Comp} */
    render: function() {...},
    /** @this {Comp} */
    otherMethod: function() {...}
});
/** @typedef {ReactElement.<Comp>} */
var CompElement;

Things of note in the transformed code:

  • The CompInterface type is necessary in order to teach the compiler about all the methods that are present on the component. Having it as an @interface means that no extra code ends up being generated (and the existing code is left untouched). The methods in the interface are just stubs — they have the same parameters (and JSDoc is copied over, if any), but the body is empty.
  • The @typedef is added to the component variable so that user-authored code can treat that as the type (the interface is an implementation detail).
  • The @this annotations that are automatically added to all component methods means that the compiler understands that those functions do not run in the global scope.
  • The CompElement @typedef is designed to make adding types to elements for that component less verbose.

A bit more formally, these are the types that the compiler knows about given the Comp definition:

  • ReactClass.<Comp>, for the class definition
  • ReactElement.<Comp> for an element created from that definition (via JSX or React.createElement())
  • Comp for rendered instances of this component (this is subclass of ReactComponent).

This means that, for example, you can use {Comp} to as a @return, @param or @type annotation for functions that operate on rendered instances of Comp. Additionally, React.render invocations on JSX tags or explicit React.createElement calls are automatically annotated with the correct type.

To teach the compiler about the React API, I ended up having a types.js file with the full API definition (teaching the compiler how to parse the module boilerplate seemed too complex, and in any case the React code does not have type annotations for everything). For the actual type hierarchy, in addition to looking at the terminology in the React source itself, I also drew on the TypeScript and Flow type definitions for React. Note that this is not an externs file, it's injected into the React source itself (since it's inert, it does not result in any output changes). This means that all React API calls can be renamed (with the exception of React.createElement, which cannot be renamed due to the collision with the createElement DOM API that's in another externs file).

Having done the basics, I then turned to mixins (one of the reasons why we're not using ES6 class syntax for components). I ended up requiring that mixins be wrapped in a React.createMixin(...) call, which was introduced with React 0.13 (though it's not documented). This means that it's possible to cheaply understand mixins: [SomeMixin] declarations in the compiler pass without having to do more complex source analysis.

The README covers more of the uses and gotchas, but the summary is that Quip itself is using this compiler pass to pre-process all our client-side code. The process of converting our 400+ components (from the externs type annotations) took a couple of days (which included tweaks to the pass itself, as well as fixing a few bugs that the extra checks uncovered).

The nice thing about having custom code in the compiler is that it provides an easy point to inject more React-specific behavior. For example, we're heavy users of propTypes, but they're only useful when using the non-minified version of React — propTypes are not checked in minified production builds. The compiler pass can thus strip them if compiling with the minified version.

Flow was the obvious alternative to consider if we wanted static type checking that was React-aware. I also more recently came across Typed React. However, extending the Closure Compiler allows us to benefit from the hundreds of other (non-React) source files that have Closure Compiler type annotations. Additionally, the compiler is not just a checker, it is also a minifier, and some minification passes rely on type information, thus it is beneficial to have type information accessible to the compiler. One discovery that I made while working on this project is that the compiler has a pass that converts type expressions to JSDoc, and generally seems to have some understanding of type expressions that (at least superficially) resemble Flow's and TypeScript's. It would be nice to have one type annotated codebase that all three toolchains could be run on, but I think that's a significant undertaking at this point.

If you use React and the Closure Compiler together, please give the pass a try (it integrates with Plovr easily, and can otherwise be registered programatically) and let me know how it works out for you.
  1. I continue to find doing large-scale refactorings less scary in our client-side code than ones in our server-side Python code, despite better test coverage in the latter environment.
  2. I ended up contributing to it a bit, as we started to use less common React APIs.
  3. Spelunking through React's codebase that I did much later turned up keyOf and many other indicators that React was definitely developed with unquoted property renaming minification in mind.
  4. Indeed the original creator of the React externs file has indicated that he's no longer using the combination of React/Closure Compiler.
  5. Which used JSX, but that was not of interest to the Closure Compiler: it was transformed to plain JavaScript before the compiler saw it.

WKWebView Communication Latency #

One of the many exciting things about the modern WebKit API is that it has an officially sanctioned communication mechanism for doing JavaScript-to-native communication. Hacks should no longer be necessary to get data back out of the WKWebView. It is a simple matter of registering a WKScriptMessageHandler on the native side and then invoking it with window.webkit.messageHandlers.<handler name>.postMessage on the JS side.

After a heads-up from Jordan that messaging latency with the new web view was not that great, I extended the test bed I had developed to measure UIWebView communication mechanisms to also measure this setup. I got results that mirrored Jordan's experiences — on an iPad mini 2 (A7), UIWebView's best officially supported communication mechanism (changing location.hash¹) took 0.44ms, while the same round trip on a WKWebView took 3.63ms. I was expecting somewhat higher latency, since there is a cross-process IPC involved now, but not this much higher.

Curious as to what was going on, I pointed a profiler at the test harness, and got the following results.

Running Time         Symbol Name
4147.0ms   94.1%     Main Thread
                         10 stack frames elided
2165.0ms   49.1%             IPC::Connection::dispatchOneMessage()
2164.0ms   49.1%              IPC::Connection::dispatchMessage(…)
2161.0ms   49.0%               WebKit::WebProcessProxy::didReceiveMessage(…)
2160.0ms   49.0%                IPC::MessageReceiverMap::dispatchMessage(…)
2137.0ms   48.4%                 void IPC::handleMessage<…>
2137.0ms   48.4%                  WebKit::WebUserContentControllerProxy::didPostMessage(…)
2132.0ms   48.3%                   ScriptMessageHandlerDelegate::didPostMessage(…)
1274.0ms   28.9%                    -[JSContext initWithVirtualMachine:]
 769.0ms   17.4%                    -[JSContext init]
 30.0ms     0.6%                 -[BenchmarkViewController userContentController:didReceiveScriptMessage:]
 16.0ms     0.3%                 -[JSValue toObject]

It looks like nearly half the time is spent in JSContext² initializers. As previously mentioned, the WKWebView API is open source, so it's actually possible to read the source and see what's going on. If we look at the ScriptMessageHandlerDelegate::didPostMessage source we can see that indeed for every postMessage() call on the JS side a new JSContext is initialized to own the deserialized value.

Even when not doing any postMessage calls on the JS side, and just measuring WKWebView's evaluateJavaScript:completionHandler: latency, there was still lots of time spent in JSContext initialization. This turned out to be because the completion handler also results in a JSContext being created in order to own the deserialized value. Thankfully this only happens if a completion handler is specified and there is a result, in other cases the function exits early.

After thinking about this some more, it occurred to me that the old location.hash mechanism could still work with a WKWebView. By adding a WKNavigationDelegate to the web view, it's possible to observe location changes on the native side. I implemented this approach and was pleasantly surprised to see that it took 0.95ms. This was almost 4x faster than the officially sanctioned mechanism (albeit still about twice as slow as the equivalent on a UIWebView, but that is presumably explained by the IPC overhead).

I then wondered if using location.hash to communicate in both directions (changing the location on the native side, listening for hashchange events on the JS side) would be be even better (to bypass more of the JS execution machinery), but that approach ended up being slower (for both UIWebView and WKWebView) since it involved more delegate invocations.

Putting all this together, here are the results (in milliseconds, averaged over 100 round trips) using these mechanisms on various devices (all running iOS 8.1) using my test bed.

Method/Device iPhone 5 (A6) iPad mini 2 (A7) iPhone 6 (A8) Simulator (Core i7)
UIWebView
location.hash 0.63 0.44 0.37 0.15
WKWebView
WKScriptMessageHandler 6.97 3.63 3.03 2.75
location.hash 1.3 0.95 0.77 0.32

I reported this performance problem to Apple last summer (while iOS 8 was still in beta), but I haven't seen activity in this area. Ideally there would be a way to skip over JS value deserialization altogether, for cases where the client doesn't actually benefit from the built-in parsing that is done. Specifically, Quip uses Protocol Buffer-encoded messages to have richer (and typed) data passed back and forth between the native and JS side, and so, as far as the JS runtime is concerned, they're all strings anyway.

Separately, it is a good question as to why I'm making such a big fuss over the overhead of one millisecond (or three) per call. Quip continues to be a “hybrid” app, with the editing experience implemented in a web view (a UIWebView for now). With the launch of spreadsheets we now have even more native ↔ web communication, and in some cases we notify the web view of touch events continuously while UIScrollViews are scrolled (for custom behavior³). When trying to hit 60 frames per second, spending 3 milliseconds of your 16 millisecond budget on pure overhead feels wasteful.

Update on 06/29/2015: Mark Lam recently fixed ScriptMessageHandlerDelegate::didPostMessage to reuse JSContext instances across calls, which fixes one of the two performance problems that this post covers. I've filed another bug to track the remaining issue with evaluateJavaScript:completionHandler:.

Update on 08/12/2015: The other bug has been fixed too, and both fixes are live in iOS 9. I have also discovered additional alternative mechanisms that perform better. See my more recent post about the current state of things.

  1. Astute observers will remark that my blog post used to recommend either changing location.hash or using the click() method on an anchor node. I have since discovered that click() results in a forced layout recalculation (via hit testing) as part of dispatching the event. I have since updated the post to recommend location.hash.
  2. I find it a bit odd that JavaScriptCore is not part of Apple's web-accessible documentation set. Even their own release notes announcing the framework say “for information about the classes of this framework, see the header files.”
  3. This involved yet more spelunking into UIWebView internals, something I will hopefully be posting about soon.

How did Quip implement the spreadsheet feature? #

I originally posted this on Quora, but I thought it would be good to archive it more permanently here.

For some background on Quip's technology stack, see What technologies were used to build Quip? and How is Quip's web client implemented?

The formula engine for spreadsheets is implemented in JavaScript. This allows the same calculations to be done in a few places:

  • Interactively on the web, without waiting for a server response
  • Interactively on mobile devices (even without a network connection)
  • On the server-side (Quip primarily uses Python on the server, we used pyv8 to wrap the formula engine such that the server could use it).

Spreadsheets are stored using the same data model as documents: divided up into sections (roughly analogous to paragraphs in text) -- each cell, row, column and table is a section. This enables heterogeneous documents, with images, text, list and spreadsheets and allows Quip's syncing engine to be reused for spreadsheets.

Spreadsheet rendering is implemented in JavaScript, HTML and CSS on all three platforms (web, iOS and Android -- Quip's entire document editing codebase is shared). Unlike Quip's previous table feature (where table cells were distinct components), the entire spreadsheet is a single component that handles its own updating of "child" sections (cells, rows and columns). This allows rendering to be much faster, since the spreadsheet component can make certain assumptions about child layout and DOM structure that the more generic table code could not.

Editing is handled in a platform specific manner, since the built-in keyboards on mobile would not have been appropriate for numeric and formula cells. Editing functionality is abstracted out behind an interface, which has a DOM implementation on the web, and a JavaScript stub on mobile platforms that makes the necessary calls to the native cell editing UI.